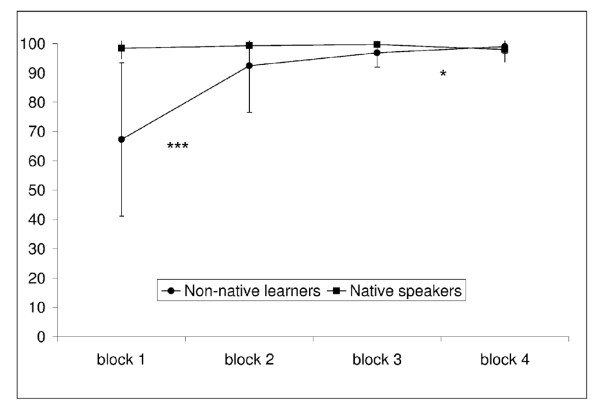
Figure 1.
Performance rates. This figure illustrates performance rates for each group of participants in each testing block. The y-axis represents the percentage of correct responses. The asterisks stand for the statistical significance of the difference between two subsequent testing blocks (*** = p < .0001, * = p < .05).

