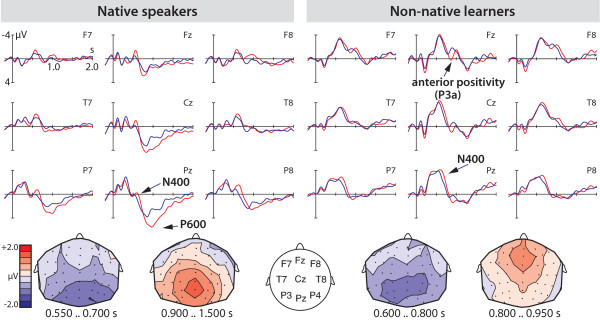
Figure 2.
ERP results. ERPs of correctly (blue lines) and incorrectly suffixed (red lines) verbs in native speakers of Italian and non-native learners. The legend including the definition of the time and amplitude axis is displayed at the upper left panel (electrode F7). The isovoltage maps show the scalp distributions of the difference potentials between incorrectly and correctly suffixed verbs. The legend showing the colourcoding of the amplitudes in the isovoltage maps is displayed at the left side of the scalp images.

