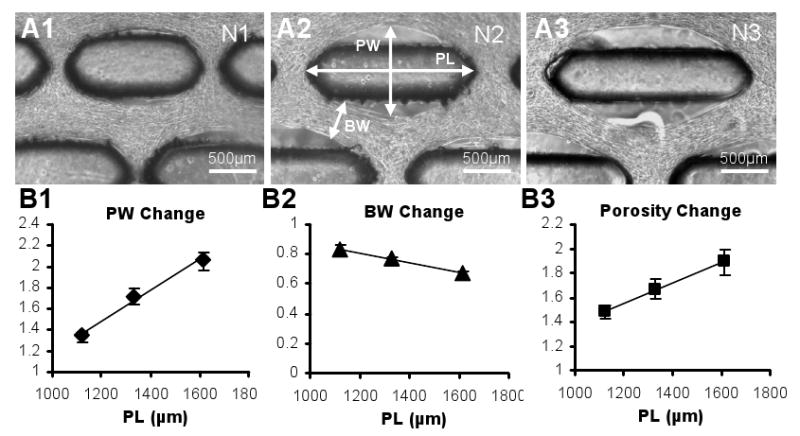
Figure 4. Effect of PDMS post length on the skeletal muscle tissue network dimensions and porosity.

(A1-3) Representative phase contrast images of three tissue networks (N1-3) after 9 days of culture, fabricated using molds with post lengths of 1120μm (N1), 1330μm (N2), and 1613μm (N3). PL, maximum pore length; PW, maximum pore width; BW, minimum tissue bundle width. (B1-3) Change of PW, BW and porosity (void/total network area) relative to the respective values before gel compaction as a function of PL. For each PL, the shown relative value represents an average of individual relative values from all networks in the group. Note that due to gel anchoring at the longitudinal ends of the posts, the resulting PL is equal to the post length. Small error bars in B1-3 indicate the high reproducibility of the tissue network formation. Data for different PLs differ significantly. For all linear fits, R2>0.95.
