
Figure 2.
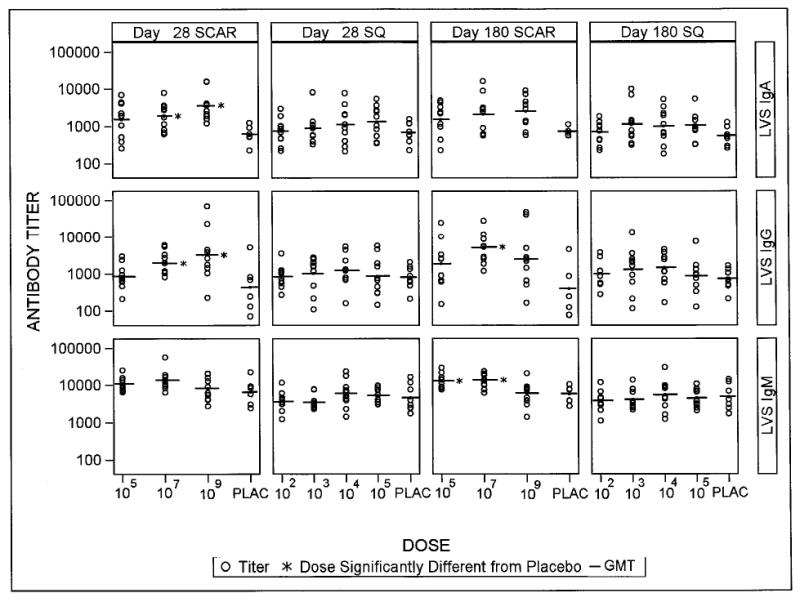
Day 28 and day 180 antibody levels by treatment group. The line represents the geometric mean titer. Dosage groups were compared to placebo using Dunnett's test control for multiple comparisons in a test. * P<0.05.
Official websites use .gov
A
.gov website belongs to an official
government organization in the United States.
Secure .gov websites use HTTPS
A lock (
) or https:// means you've safely
connected to the .gov website. Share sensitive
information only on official, secure websites.
Day 28 and day 180 antibody levels by treatment group. The line represents the geometric mean titer. Dosage groups were compared to placebo using Dunnett's test control for multiple comparisons in a test. * P<0.05.