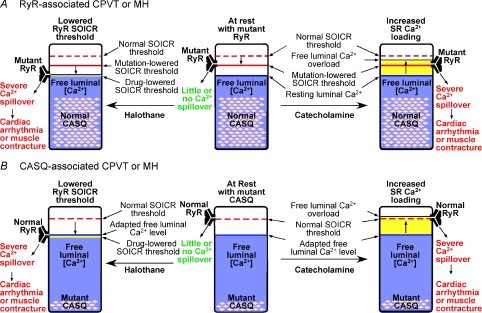
Figure 1. A model unifying the aetiology of CPVT and MH arising from mutations in RYR or CASQ genes.
The different thresholds for SOICR and the free SR luminal Ca2+ levels in CPVT or MH, associated with mutations in RYR (A) or CASQ genes (B), are illustrated in the resting state (middle panels) and stimulated states (left and right panels). The normal SOICR threshold is depicted as a dashed red bar. The SOICR threshold that is lowered as a consequence of RyR mutations, is depicted as a continuous red bar. The SOICR threshold that is lowered by drugs (halothane or caffeine) is depicted as a yellow bar in the left panels. The SR free luminal Ca2+ level is represented as a blue area. The pink lozenges within the blue areas represent functional Ca2+–CASQ complexes, which are reduced as a result of point or truncation mutants (as depicted) or abolished as a result of null mutations (not depicted). The yellow areas above the blue areas in the right panels represent an elevation, even if only transient, in the free Ca2+ levels, which, we propose, will occur when SERCA activity is enhanced by catecholamines. When the SOICR threshold is lowered below the SR free luminal Ca2+ level (left panels), or when the SR free luminal Ca2+ level surpasses, even transiently, the normal SOICR threshold (right panels), SOICR occurs, leading to a spillover of SR Ca2+ that can trigger spontaneous Ca2+ release, cardiac arrhythmias or skeletal muscle contracture.

