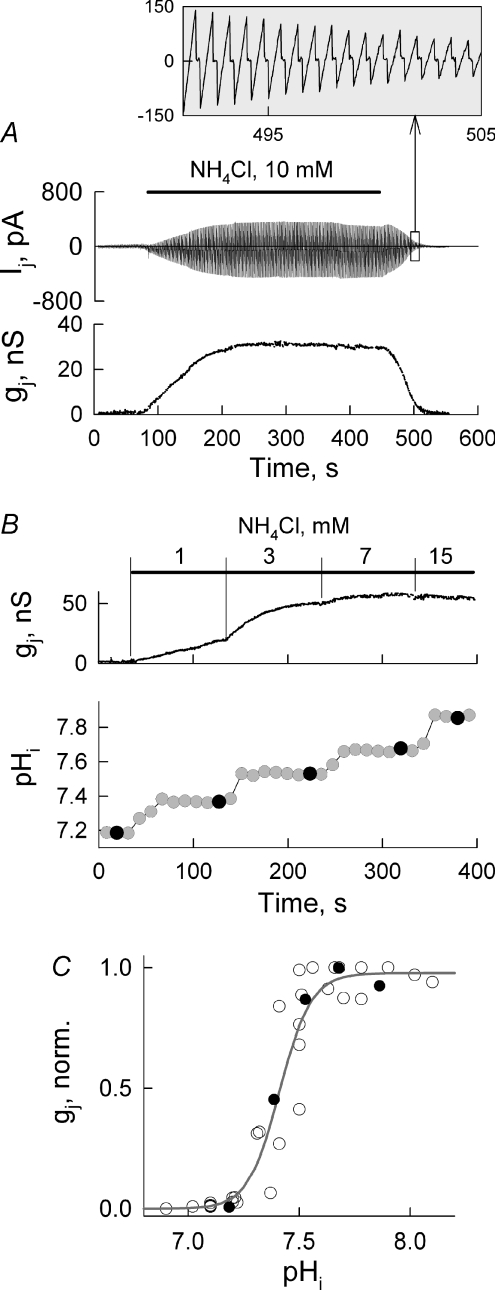
Figure 4. pHi-dependent modulation of junctional conductance.
A, dynamics of Ij and gj measured by applying repeated Vj ramps of ±20 mV (enlarged Ij responses to Vj ramps are shown in the inset) in response to applications of NH4Cl (10 mm). B, gj and pHi measurements in one cell pair after application of 1, 3, 7 and 15 mm of NH4Cl. C, summarized gj–pHi relationship in which the continuous line is a fitting curve to the Hill equation; pKa= 7.41 ± 0.02 and the Hill coefficient of 5.9 ± 0.5 (n= 6). Filled circles are from the experiment shown in B.

