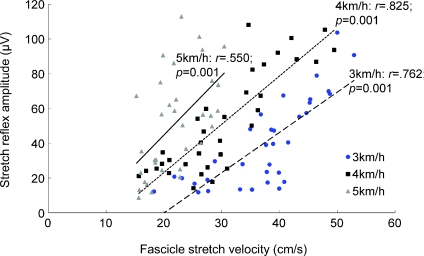
Figure 4. Scatter plots of stretch reflex amplitudes against fascicle stretch velocities at each walking speed.
Correlation coefficients and significance values are displayed for each walking speed. The linear regression equations were as follows: 2.32x– 46.4 at 3 km h−1, 2.78x– 32.4 at 4 km h−1, 3.42x– 23.6 at 5 km h−1.

