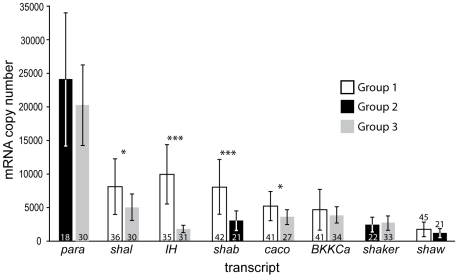
Figure 2. Mean mRNA copy numbers for 8 ion channel gene transcripts in LCs.
The LC groups were harvested and processed at different times during the year. The numbers of cells included in each analysis (n) are indicated inside or above standard deviation bars. Asterisks indicate significance differences at p<0.01 (*) or p<0.001 (***) for the same channel between two groups of cells (t-test).

