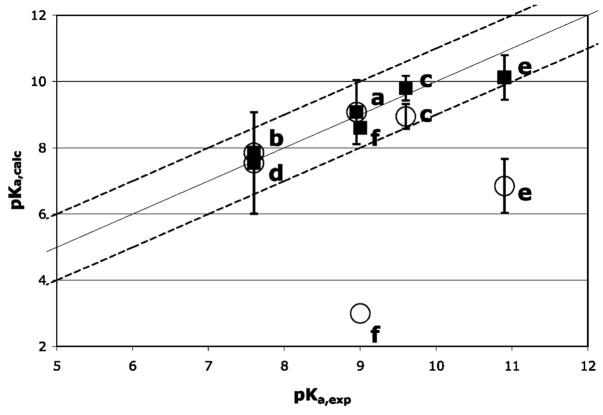
Figure 3.
Comparison of calculated and experimental pKas (■) with and (○) without the DFT correction for (a) sperm whale myoglobin, (b) Aplysia myoglobin, (c) hemoglobin I, (d) heme oxygenase, (e) horseradish peroxidase, and (f) cytochrome c oxidase. The ideal line of slope 1 passing through the origin and lines with differences between experimental and calculated of (1 pH unit (dashed lines) are shown. References for experimental values are in Table 1.

