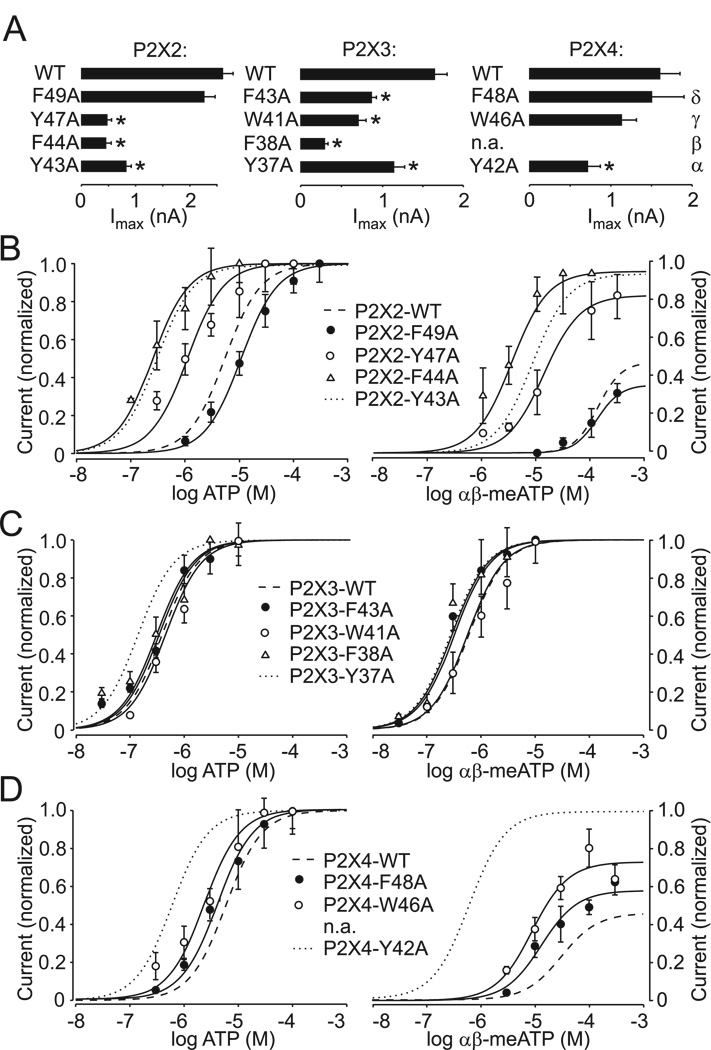
FIGURE 5. Characterization of the TM1 aromatic residue P2XR mutants.
(A) Comparison of maximum current amplitudes stimulated by supramaximal ATP concentrations in cells expressing the WT and mutant P2X2aR, P2X3R, and P2X4R. (B–D) Dose-response curves for ATP (left) and αβ–;meATP (right) in cells expressing aromatic residue mutants of the P2X2a (B), P2X3R (C), and P2X4R (D). The αβ-meATP efficacy was measured by comparison with the maximum effect of ATP.

