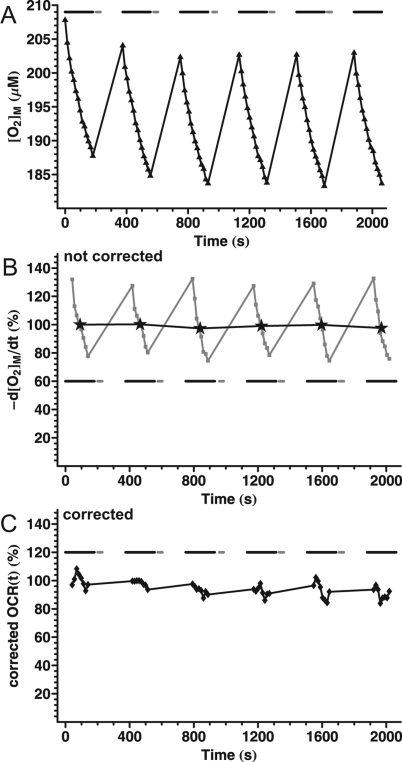
Figure 2.
Basal respiration of cortical synaptosomes in Seahorse medium containing glucose plus pyruvate. (A). Fluorescence values from a representative well in a XF24 V7 microplate were converted to [O2] using eq 5 and F0 = 44000 as determined in a separate experiment by addition of Na-dithionite. Data points correspond to the measured [O2] ([O2]M) with a 13 s data acquisition interval within the measurement periods (3 min in length; black bars). Each measurement period was followed by mixing (30 s; gray bars) and a wait period. Data are from one well and represent >5 independent plates. (B) Noncorrected basal oxygen consumption rate of synaptosomes, as calculated by temporal differentiation of the [O2]M data from (A). Stars indicate mean oxygen consumption rate for each measurement period, normalized to the first data point. Gray squares show the temporally differentiated concentration data (noncorrected oxygen consumption rate trace). The first and last three data points were dropped in each measurement period due to the effect of kernel filtering with a width of seven points for differentiation. Note that the decay of the differentiated trace is simply the reflection of the decelerating decay of [O2] in (A). (C) Corrected basal oxygen consumption rate of synaptosomes, as calculated by the compartment model correction using the time constants in Table 1.

