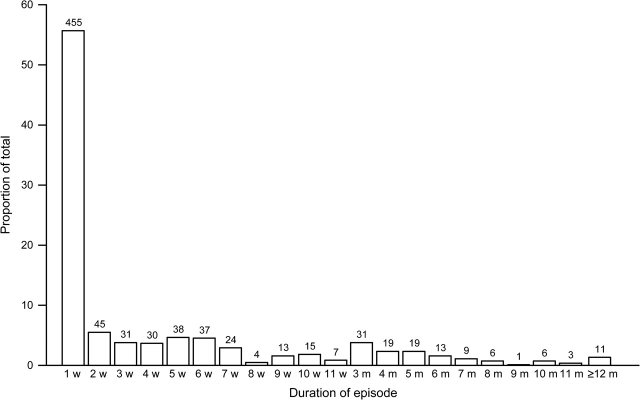
FIGURE 1.
Duration of Giardia episodes for children living in Las Pampas de San Juan, Lima, Peru, between 1995 and 1998. Duration is expressed in weeks (w) or months (m). Each bar represents the percentage of Giardia episodes that lasted a specific number of weeks or months. The numbers above the bars represent the number of episodes that lasted a specific number of weeks or months.

