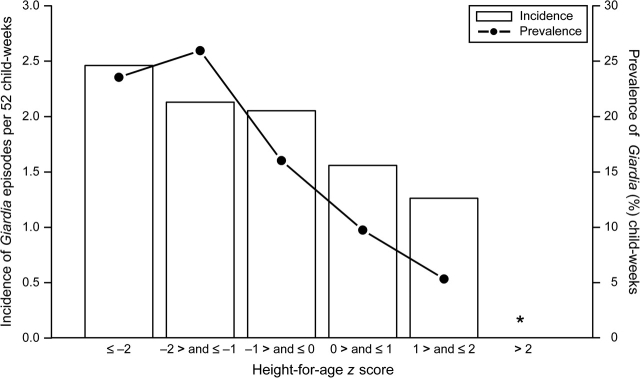
FIGURE 3.
Unadjusted incidence and prevalence of Giardia by categories of height for age, Lima. Peru, 1995–1998. We estimated incidence as the number of new Giardia episodes per 52 child-weeks and prevalence of Giardia as the proportion of Giardia-positive child-weeks. The bars represent the incidence of Giardia, and the filled circles connected by lines represent the prevalence of Giardia. “*” indicates that there were insufficient data points in the category of height-for-age z score greater than 2 to accurately estimate the incidence or prevalence of Giardia. Although single-variable analysis suggests that the risk of giardiasis varies with height for age, in the adjusted model we did not find an association between infection with Giardia and height for age (relative risk = 0.92, 95% confidence interval: 0.82, 1.04).

