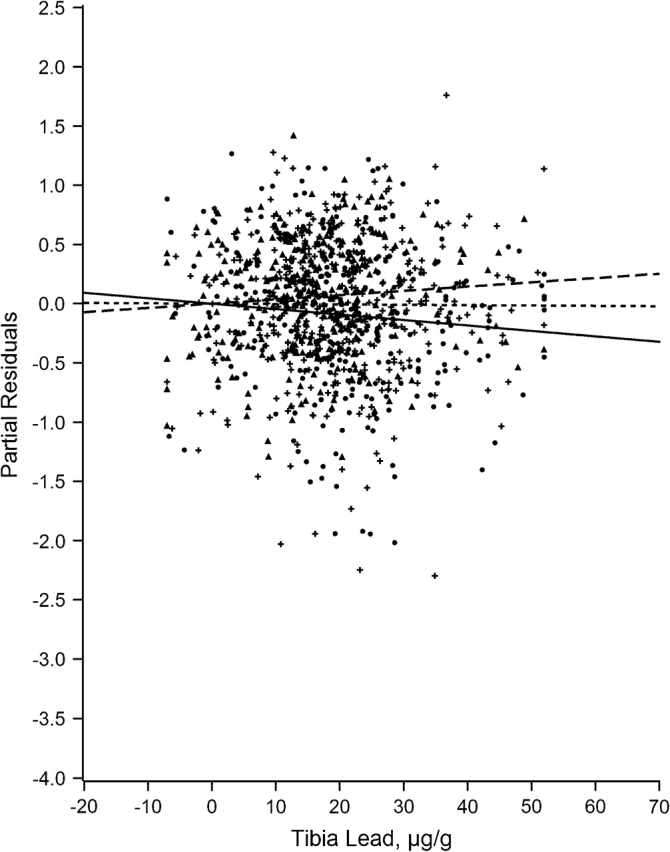
Figure 4.

Partial residual plot of executive ability by tibia lead by tertiles of neighborhood psychosocial hazards scale, Baltimore Memory Study, 2001–2005. High tertile = solid line, solid dots; middle tertile = dotted line, plus; low tertile = dashed line, triangle.
