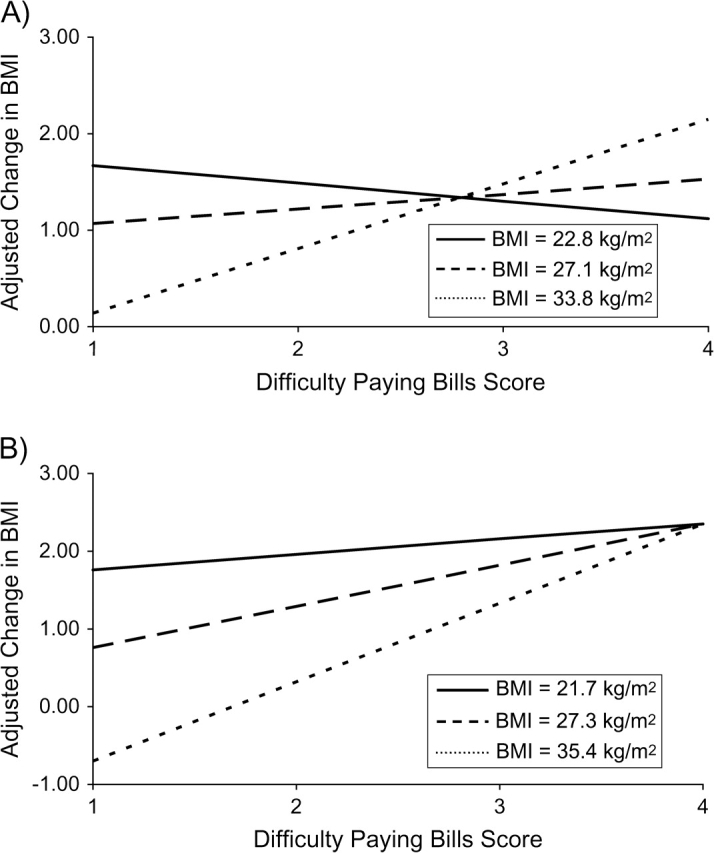
Figure 2.

Adjusted change in body mass index from 1995 to 2004 for difficulty paying bills among US men and women. Increasing difficulty paying bills was associated with a steeper gradient of weight gain among obese men (A) and women (B) than for normal weight men and women. Results were adjusted for baseline body mass index; age; race; income; presence of generalized anxiety disorder, panic attack, or depression; smoking status; quitting smoking; presence of diabetes; self-rated health; and self-rated relative health. Trend lines represent predictions from the fitted model for specified body mass index (BMI) values, set to the body mass index mean for each baseline body mass index category. In A, mean body mass index values for men are 22.8 (normal weight), 27.1 (overweight), and 33.8 (obese) kg/m2. In B, mean body mass index values for women are 21.7 (normal weight), 27.3 (overweight), and 35.4 (obese) kg/m2.
