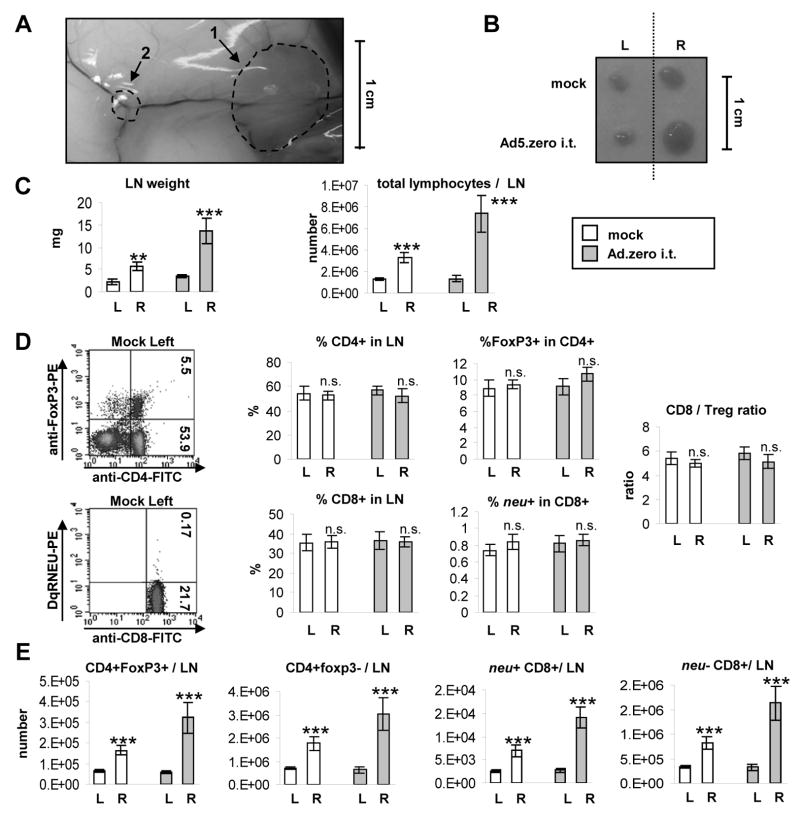
Fig. 6. Ad-induced T cell responses in the tumor-draining lymph node.
5×10⁵ MMC cells were injected subcutaneously into the right flank of neu-tg mice and 1×10⁹ pfu Ad.zero or PBS was injected once intratumorally when tumors reached a size of 3–4 mm diameter. Inguinal tumor-draining (sentinel) lymph nodes (right-flank) and contra-lateral non-tumor-draining (non-sentinel) lymph nodes (left flank) and spleens (Fig. S12) were harvested 6 days after intratumoral injection (n=5 animals/group). L=left flank; R=right flank. A. Representative picture of sentinel LN and MMC tumor in situ. Note the vascularization of tumor and LN. B. Representative picture of sentinel LN (R) and non-sentinel LN (L). C. LN weight (left panel) and total lymphocyte number per LN (right panel) D. Percentages of neu−/+CD8+ T cells, regulatory T cells (CD4+FoxP3+) and T helper cells (CD4+Foxp3−) were determined using flow cytometry. Left panel. Representative flow charts are shown. Middle panel. Percentages of CD4+ and CD8+ T cells in TIL, Foxp3+ in CD4+ and neu+ in CD8+ T cells are shown. Right panel. Ratio of CD8/Treg was calculated. E. Total amount of different lymphocyte populations per LN was calculated using the data from C and D. C-E. Bars indicate mean and SD. P>0.05, n.s. (not significant); *, P<0.05; **, P<0.01; ***, P<0.001 (two-sided Student’s t-test).

