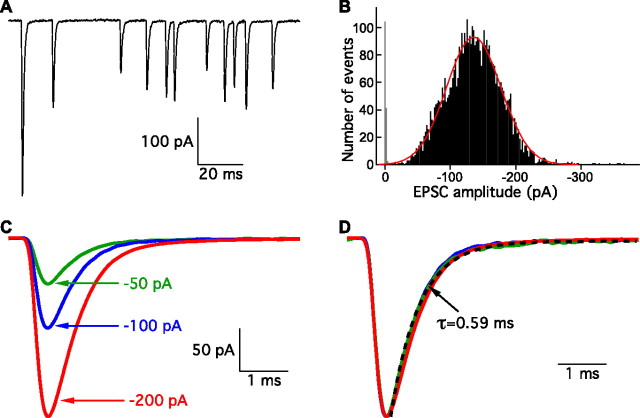
Figure 1.
Spontaneous EPSCs. A, Spontaneous EPSCs recorded from an afferent fiber exhibit a broad range of amplitudes. B, The amplitude distribution of 4884 spontaneous EPSCs is fit well with a Gaussian function (red). The average EPSC amplitude is −137 pA. The noise amplitude distribution is shown in gray. C, Averages of 10–20 EPSCs with amplitudes of −50 ± 2 pA (green), −100 ± 2 pA (blue), and −200 ± 2 pA (red) show that events of these different size classes possess smooth rise and decay phases. D, Normalization of the three groups of EPSCs in C reveals that they have similar kinetics. The dashed black line is a single-exponential fit to the decay phase of the −50 pA group. Traces in A–C are all from the same afferent fiber recording.

