
Figure 1.
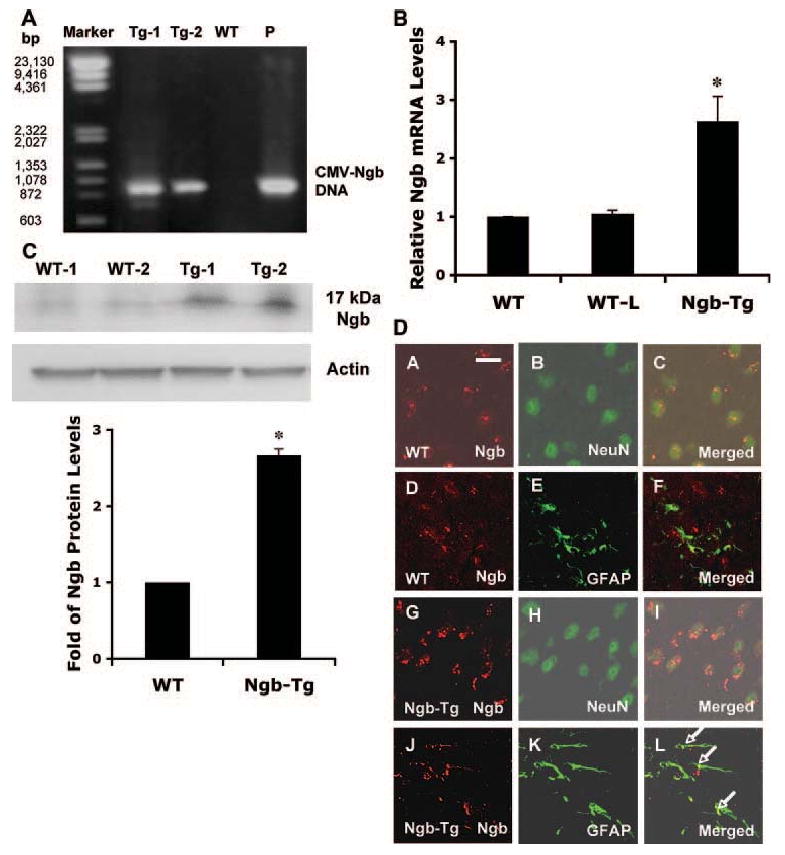
Production and characterization of Ngb-overexpressing transgenic mice. A, Tail DNA was used for PCR analysis with primers flanked CMV and Ngb sequence. The detected 940-bp band of PCR production indicates the presence of mouse Ngb transgene. DNA markers (Marker) appeared on the first lane; pCMV-Ngb plasmid served as a positive control (P). B, Brain RNA was extracted for measuring Ngb mRNA levels by quantitative real-time PCR. There was an approximately 2.6-fold increases of Ngb mRNA levels in Ngb-Tg mouse brains compared with WT and WT littermates (WT-L); similar Ngb mRNA levels were detected in WT (C57BL/6) and WT-L mouse brains. All animals used were 22 to 26 males between 10 and 12 weeks of age. Mean±SEM, n=6 per group, *P<0.05. C, Top panel is a representative Western blot showing the increase of Ngb protein in Ngb-Tg mouse brains (Tg) compared with WT controls. Actin served as equal loading controls. Lower panel shows relative Ngb protein expression levels quantified by optical density of Ngb protein bands. Mean±SEM, n=4 per group, *P<0.05. D, In cerebral cortex, immunohistochemistry showed Ngb immunoreactivity was mainly colocalized with neuron marker neuronal nuclei (D, A–C), not colocalized with astrocyte marker glial fibrillary acidic protein (D, D–F) in WT mice. By comparison, Ngb immunoreactivity was enhanced in neurons (D, G–I), some colocalized with astrocyte marker glial fibrillary acidic protein as pointed out by arrows (D, J–L) in Ngb-Tg mice. Bar: 50 μmol/L.