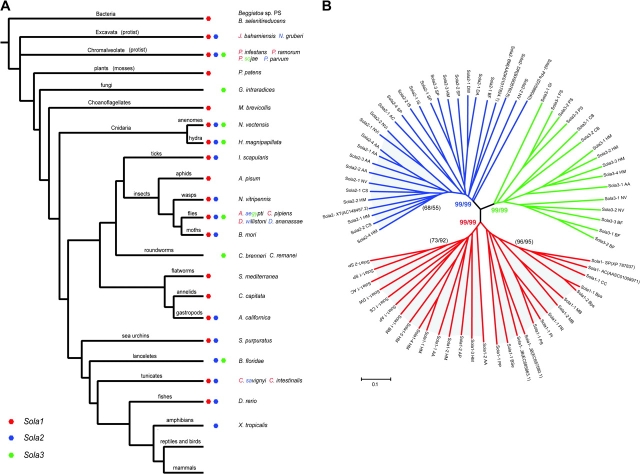
FIG. 1.—
The species distribution of Sola elements (A) and the phylogenetic tree of the Sola TPases (B). The red, blue, and green colors represent Sola1, Sola2, and Sola3 groups, respectively. For those species, harboring more than two different Sola groups, their species names are decorated with the corresponding colors of Sola groups. The phylogenetic relationship of species is based on published literature (Pennisi 2003), and the taxonomic classification of protists is obtained from Adl et al. (2005). The phylogenetic tree was based on the alignment in the core region (from six amino acids upstream of the first catalytic D to ∼30 amino acids downstream of the last catalytic D residue), and was reconstructed by Neighbor-Joining method (shown here) and minimum evolution method (not shown). Tree reconstructed by the minimum evolution method showed a similar topology. The bootstrap values of each Sola group, derived from Neighbor-Joining and minimum evolution analysis, respectively, are shown in color. The two clades in Sola1 and one potential clade in Sola2 are shaded out, and their bootstrap values are shown in parentheses. The species and transposon families are listed in tables 1–3.

