
FIG. 3.—
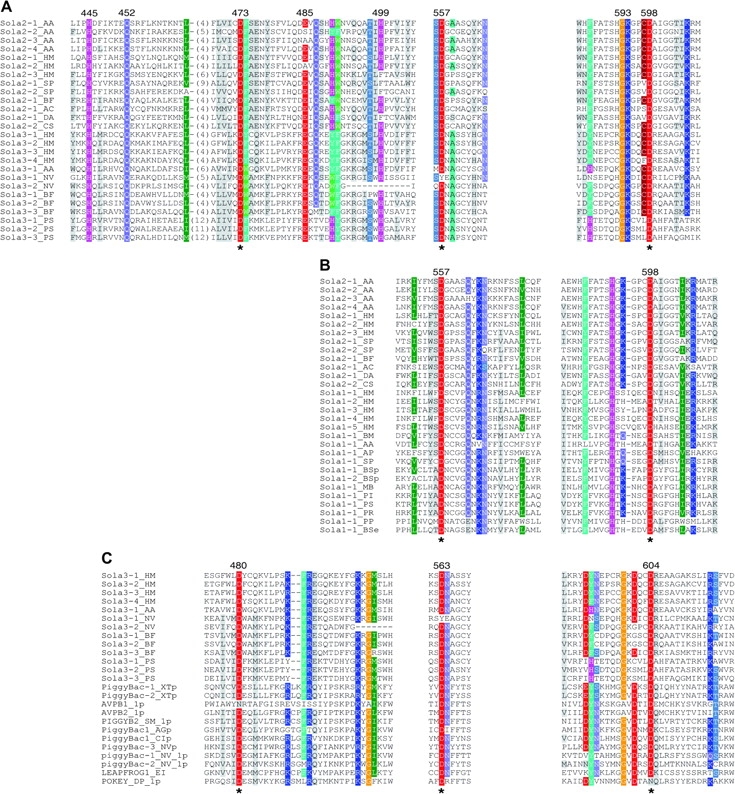
Similarities in the local catalytic areas between Sola2 and Sola3 (A), between Sola1 and Sola2 (B), and between Sola3 and PiggyBac TPases (C). The positions of the catalytic residues in the alignments are indicated with asterisks (*) below. Highly conserved or similar amino residues between groups or superfamilies are colored, less conserved residues are shaded gray. The names of individual Sola2, Sola3, and Sola1 TPases are listed in tables 1–3. The PiggyBac TPases and their names are derived from the Repbase. (A) The three catalytic blocks are shown on the left, middle, and right. The residue positions in the sequence of the Sola2-1_AA TPase are shown above. (B) The second and the third catalytic blocks are shown. The residue positions in the sequence of the Sola2-1_AA TPase are shown above. (C) Three catalytic blocks are shown. The residue positions in the sequence of the Sola3-1_HM TPase are shown above.