
FIG. 5.—
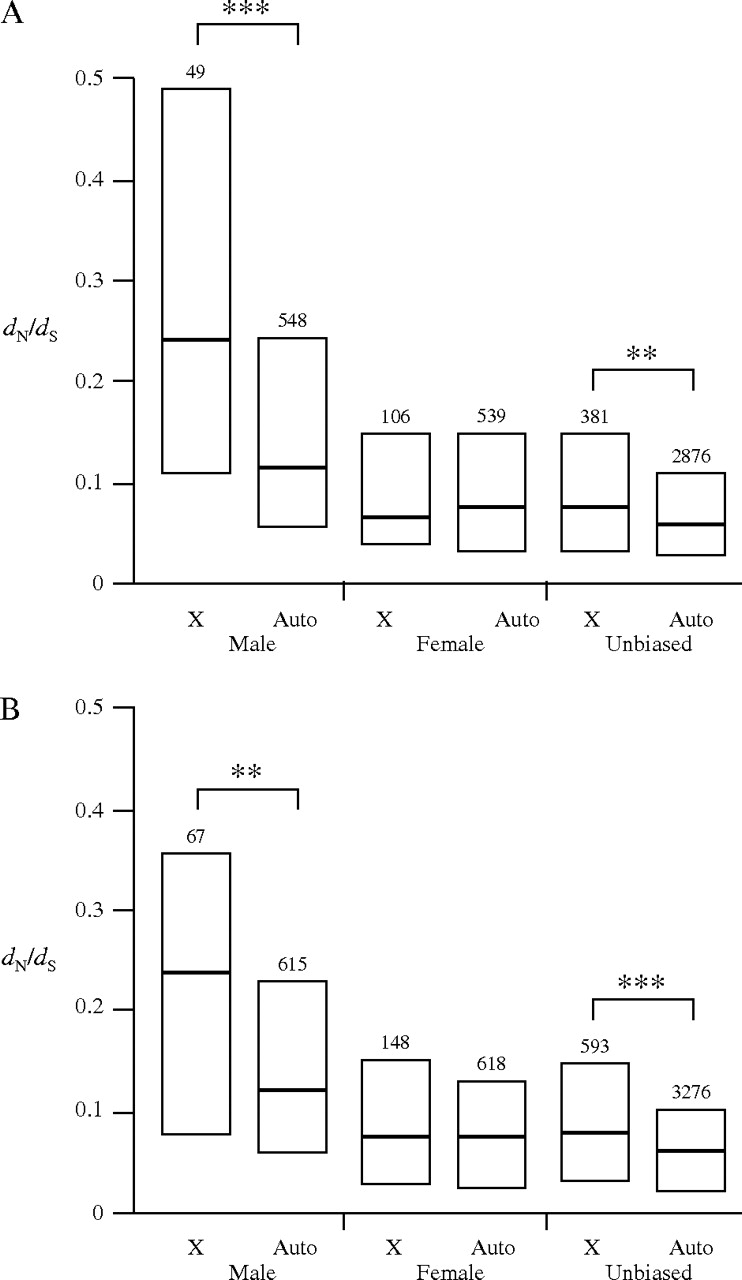
Evolutionary rates of X-linked and autosomal genes with male-, female-, or unbiased expression for whole-genome comparisons of (A) Drosophila melanogaster and Drosophila simulans or (B) D. melanogaster and Drosophila yakuba. Boxes represent the interquartile range, and heavy lines indicate the median. The number of genes in each class is given above the box. Brackets indicate significant differences between X-linked and autosomal genes within a given expression class. **P < 0.01, ***P < 0.001.