
FIG. 1.—
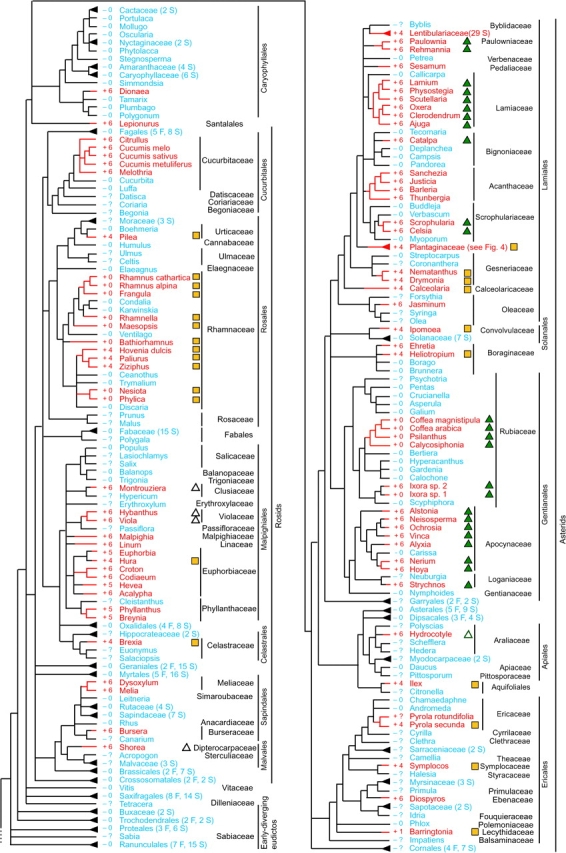

Distribution of the cox1 intron among 640 angiosperms for which cox1 has been sampled. Presence of the intron is shown by red branches on the tree, red taxon names, and plus (+) symbols. Blue lines and names and minus (−) symbols identify taxa lacking the intron. Question marks indicate that exon sequences are not available for that taxon. Blue and red triangles at the tips of branches indicate multiply sampled terminals, with the number of sampled taxa given in parentheses according to the number of families (F) and species (S) sampled. Numbers to the immediate left of plant names give the number of nucleotides changed by exon coconversion (for most collapsed clades, CCT data are available for only a few taxa, whereas full CCT data for the Plantaginaceae are shown in figs. 2 and 3). Open and filled green triangles identify introns belonging to 2 large, nested intron clades so-marked near the top of figure 5. Yellow squares likewise identify introns belonging to the well-supported, so-marked clade at the bottom of figure 5.