
FIG. 2.—
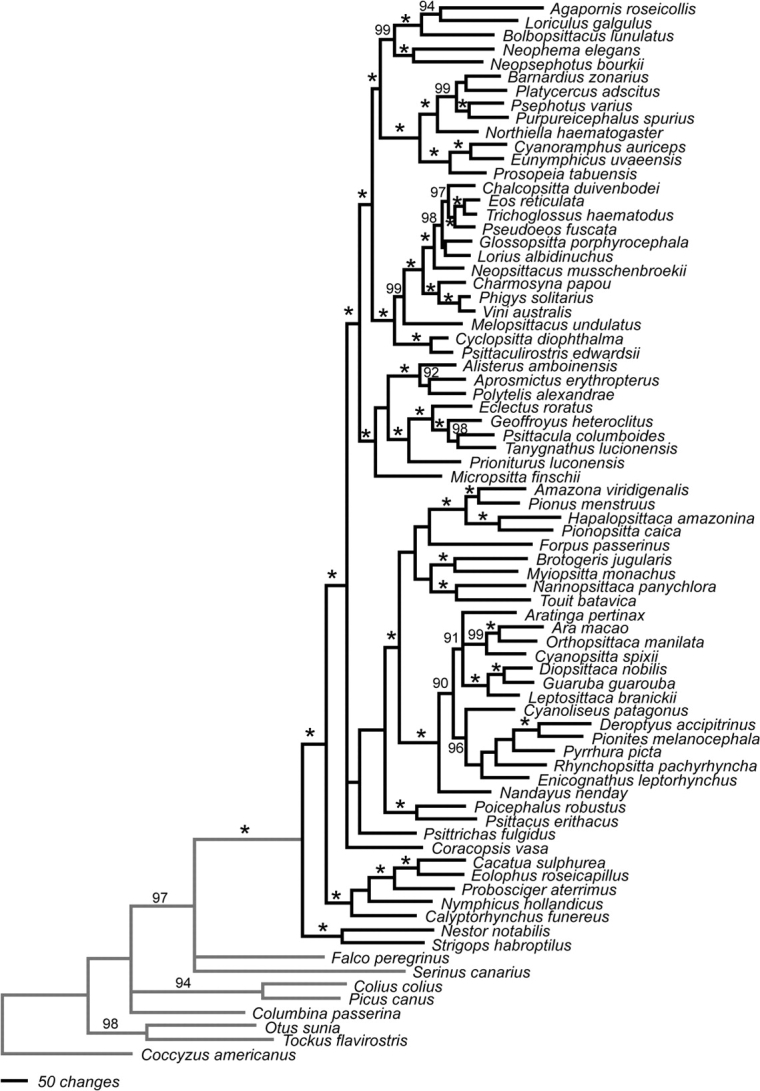
Phylogram of relationships among representatives of 69 parrot genera and 8 outgroup taxa based on Bayesian analysis of the 4 sequence partitions (COI + ND2, TROP, TGFB2, and RDPSN) and a fifth partition consisting of coded gaps from the 4 sequence partitions. Bayesian posterior probabilities ≥0.90 are indicated as percentages above the branches, values of 1.0 are indicated with an asterisk. The scale bar indicated the number of changes (base substitutions or changes in state of indel characters).