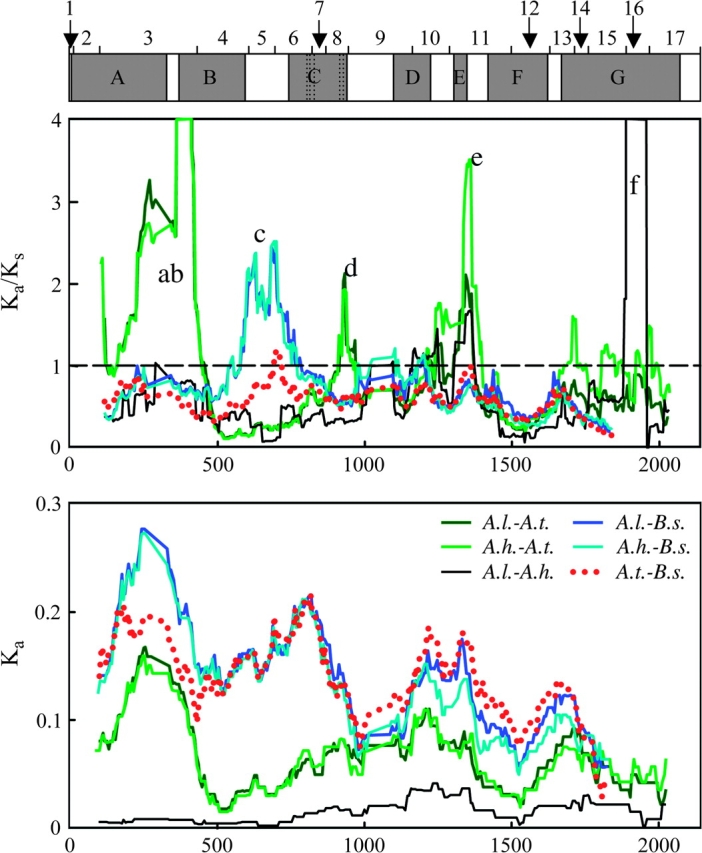
FIG. 2.—

Sliding window plots for Ka/Ks (window size = 200 bp, step size = 5 bp) and Ka (window size = 150 bp, step size = 5 bp) of comparisons between species pairs: Arabidopsis thaliana (A.t.), Arabidopsis lyrata (A.l.), Arabidopsis halleri (A.h.), and Boechera stricta (B.s.). Color coding is the same in both plots. The small letters in the upper plot indicate regions with elevated Ka/Ks discussed in the text. At the top of the figure is a map of exons (1–17) and functional domains (gray boxes): (A) an important region for the interaction between MEA and FIE (Spillane et al. 2000; Yadegari et al. 2000); (B) EZD1 and (C) EZD2 are found in E(Z) homologs but their function is unknown; (D) a SANT domain, which may be involved in histone binding (Boyer et al. 2004); (E) a putative nuclear localization signal (NLS); (F) a cysteine-rich region (CXC), which may be important in protein folding (Sardiu et al. 2007). (G) a SET domain, which has H3K27 methylation activity (Springer et al. 2002; Ng et al. 2007).
