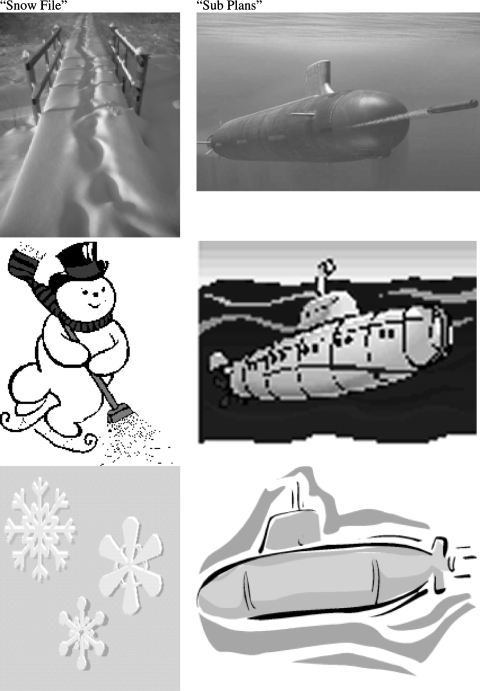
Fig. 2.
Examples of how images differed for each picture matching task block in the Deep Study condition (note: colorful images are shown here in grayscale). Presentation of each probe concept (e.g., “snow file” or “sub plans”) was depicted using a full color photograph (toprow), a sparse color sketch (middlepanel), and a grayscale illustration (bottompanel)

