Abstract
We showed that Eμ-MiR-155 transgenic mice develop acute lymphoblastic leukemia/high-grade lymphoma. Most of these leukemias start at approximately 9 months irrespective of the mouse strain. They are preceded by a polyclonal pre–B-cell proliferation, have variable clinical presentation, are transplantable, and develop oligo/monoclonal expansion. In this study, we show that in these transgenic mice the B-cell precursors have the highest MiR-155 transgene expression and are at the origin of the leukemias. We determine that Src homology 2 domain–containing inositol-5-phosphatase (SHIP) and CCAAT enhancer-binding protein β (C/EBPβ), 2 important regulators of the interleukin-6 signaling pathway, are direct targets of MiR-155 and become gradually more down-regulated in the leukemic than in the preleukemic mice. We hypothesize that miR-155, by down-modulating Ship and C/EBPβ, initiates a chain of events that leads to the accumulation of large pre-B cells and acute lymphoblastic leukemia/high-grade lymphoma.
Introduction
B-cell lymphomas represent the majority of the lymphoid neoplasms, and despite important steps made toward the understanding of their molecular basis, little is known about the initiating factors. Recently, a newly discovered class of noncoding RNAs called microRNAs, with roles in the posttranscriptional regulation of mRNAs, has emerged as possibly implicated in cancer pathogenesis.1
We and other groups identified alterations of miRNA expression in various cancers ranging from leukemias2 to solid tumors.3 Whole genome expression assays revealed that microRNA deregulations are tumor specific, and that they could predict the clinical course and outcome. Therefore, it seems that microRNA profiling could constitute a “signature” useful to differentiate various types of tumors and predict their possible clinical course.2 Because one miRNA can control the translation of multiple mRNAs simultaneously, a single modification of their expression could reverberate on various biologic levels.
Among the many miRNAs identified as being involved in cancer, some seem to be more relevant. The list includes MiR15a/16-1 down-regulated in chronic lymphocytic leukemia,4 MiR21 overexpressed in breast cancer and a plethora of other solid malignancies,3,5 and the cluster MiR17-92, which seems to act as an oncogene in hematologic malignancies and possibly also in solid malignancies.6 In addition, MiR-155 was found overexpressed in several types of B-cell leukemias/lymphomas,2,7,8 with the highest level of expression in diffuse large B-cell lymphomas.7
Despite the large number of in vitro studies designed to understand microRNAs' roles in cancer, there are only very few animal models available that could help us assess the impact of their deregulation in complex organisms.
We have previously reported9 the creation of the Eμ/VH MiR-155 transgenic mice. They present a block at the pre-B stage of B-cell differentiation at an early age (3-4 weeks), followed by a pre–B-cell proliferation that later translates into frank acute lymphoblastic leukemia/high grade lymphoma.
Now we present a detailed characterization of their immunophenotype and describe a possible mechanism for these leukemias. Initially, all transgenic mice show an increase of the B220+ immunoglobulin (Ig)M− population; later on, these cells tend to lose some of the B220 surface antigen expression and become B220low; thus, the leukemias studied exhibit a mixed immunophenotype characterized by B220lowIgM− and B220lowIgM+ (most likely due to some degree of differentiation of some of the malignant clones of the pre-B cells of origin). Moreover, all transgenic mice exhibit an increase of the myeloid line and a reduced T-cell population with no significant changes in the CD4/CD8 ratio.
MiR-155 transgene was found differentially expressed in various hematopoietic organs and B-cell subpopulations, reaching a maximum in the bone marrow and pre-B cells.
To understand the role of MiR-155 in the B-cell differentiation and leukemogenesis, we focused on 2 proteins known to be both key molecules in B-cell maturation/activation and predicted targets of this miR.
Src homology 2 domain–containing inositol-5-phosphatase (SHIP) is a negative regulator of the cell signaling in the immune system.10 This phosphatase is also thought to be implicated in the B-cell maturation because it has a differential expression in the pro-B compared with the pre-B stage.11,12 Irradiated mouse bone marrow reconstituted with Ship−/− hematopoietic cells shows a reduction in the immature and mature forms of B cells.11,12 Moreover, Ship−/− cells were more viable and had better survival due to the activation of the mitogen-activated protein kinase (MAPK) and phosphatidylinositol 3-kinase (PI3K)/protein kinase B (AKT) pathways.11
CCAAT enhancer-binding protein β (C/EBPβ; nuclear factor–interleukin [IL]-6) is another mediator of the IL-6 signaling pathway; IL-6 activates C/EBPβ through the phosphorylation of MAPK.13,14 In addition, C/EBPβ expression varies during differentiation of myeloid and plasma cells,15–17 suggesting its involvement in myeloid and lymphoid maturation. Mice lacking C/EBPβ showed a lymphoproliferative disorder nearly identical to a rare and aggressive form of human Castelman disease, characterized by lymphoid follicular hyperplasia due to an acceleration of the B-cell maturation and accumulation of IgG1-secreting lymphoid subpopulation.18 A knockout mouse model for MiR-155 recently published19 showed a depletion of B lymphocytes in the germinal center, whereas a knockin mouse for the same gene, in which the endogenous copies are constitutively expressed under the control of a CD21 promoter (active in mature B cells only), presented an accumulation of IgG1-secreting B lymphocytes.
In this study, we show that SHIP and C/EBPβ protein levels are diminished in the MiR-155 transgenic pre-B lymphocytes. SHIP is gradually down-regulated in the preleukemic and leukemic pre-B cells, whereas C/EBPβ, even though it maintains the same level of expression in the preleukemic mice, is markedly diminished in the leukemic pre-B cells. Thus, we conclude that MiR-155 transgene has a maximum of expression in the pre-B stage, in which it down-regulates both Ship and C/EBPβ, 2 inhibitors of IL-6. This blocks the B-cell differentiation and might also induce a reactive proliferation of the myeloid line. The B-cell precursors, arrested in their development, proliferate and are at the origin of malignant leukemias with a mixed immunophenotype B220low/IgM− and B220low/IgM+.
Methods
Transgenic mice
MiR-155 transgenic mice have been generated on both backgrounds, C57BL/6 and FVB, as previously described.9 Transgenic mice were housed and killed in accordance with protocols approved by the Institutional Animal Care and Use Committee of Ohio State University and local and federal regulations.
Transplants
Fresh splenocytes were collected from transgenic leukemic mice and resuspended in phosphate-buffered saline (PBS). Dilutions of 106 cells/mL were prepared and injected intraperitoneally in syngeneic mice (on average, 5 syngeneic mice were injected for each leukemic mouse). An equal number of wild-type mice, strain-, age-, and sex-matched, were then injected the same way with PBS only. Mice were kept under observation until all of the transplanted mice got sick and died.
Histology, immunohistochemistry, and flow cytometry
All sick mice were killed and weighed, together with littermate controls; spleens, liver, kidneys, lungs, and lymph nodes were collected; spleens were weighed. Fragments of spleens were fixed in 10% buffered formalin, paraffin included, stained with hematoxylin and eosin, and studied with a Olympus BX41 light microscope. Images were acquired with the Olympus software. Unstained slides were prepared and later immunohistochemically stained with in-house manufactured antibodies: CD20, CD79a, CD3, CD43, IgM, and κ and λ light chains (Children's Hospital). Single-cell suspension of splenocytes was depleted of mature red blood cells by hypotonic lysis (0.165 M NH4Cl) and stained with the following conjugated antibodies: anti-B220, anti-CD19, anti-CD138, anti-IgM, anti-IgD, anti-CD3, anti-CD4, anti-CD8, anti-CD11b, and anti-IL-4 (all antibodies were from BD Pharmingen). Flow cytometry was carried out on a BD FACSCalibur, and data were analyzed using the BD FACS Convert 1.0 for Mac software. For cell sorting, the splenocytes were stained with anti-B220 and anti-IgM; the cell sorting was carried out on a BD Aria. Three populations were selected: B220+ only, B220+/IgM+, and B220−/IgM−.
Southern blot for VDJ rearrangement
A probe was amplified in the JH4 fragment of the IgH region on the mouse genomic, using the following primers: forward, 5′-TGAAGGATCTGCCAGAACTGAA-3′; reverse, 5′-TGCAATGCTCAGAAAACTCCAT-3′, and then cloned into a TOPOTA vector (Invitrogen).
Spleens of the transgenic and wild-type mice were dissociated between frosted slides in PBS, treated with ammonium chloride for the erythrocyte lysis, centrifuged, and resuspended in PBS; DNA was extracted from the splenocytes with phenol-chloroform and digested with EcoRI and PvuII. Digested DNA was then separated on a 1% agarose gel, blotted on a HyBond N+ membrane (GE Healthcare), hybridized overnight with the JH4 probe radioactively labeled with 32P (with Klenow enzyme from PrimeIT II Random Primer Labeling kit; Stratagene), and exposed to a phosphor-image screen and processed using a Typhoon scanner (GE Healthcare).
Western blots
For Western blot on total splenocytes, cells were isolated from sick and wild-type mice, by dissociating the spleens in between 2 frosted slides; red blood cells were lysed with ammonium chloride, and proteins were extracted from the remaining white blood cells with a lysis buffer containing Tris-HCl, pH 7.5 (30 mM), NaCl (150 mM), 10% glycerol, and 1% Triton X-100 and protease inhibitors (Roche; 1 dose/7 mL buffer). A total of 80 μg proteins was then loaded, separated on a 4% to 10% sodium dodecyl sulfate–polyacrylamide gel electrophoresis (SDS-PAGE) gel in an electrophoretic X-Cell Sure Lock machine, and blotted on polyvinylidene difluoride membranes (Bio-Rad); membranes were incubated overnight with a polyclonal anti–rabbit SHIP-1 primary antibody at a final concentration of 1/100 (Millipore) and polyclonal anti–rabbit C/EBPβ 1/200 (Santa Cruz Biotechnology). The following day, membranes were incubated with an anti–rabbit secondary antibody for 1 hour. Signal was detected with an enhanced chemiluminescence kit (Amersham).
For the immunoblot on sorted splenocytes, cells were harvested, washed once with ice-cold PBS, and directly lysed in Laemmli buffer (Bio-Rad; 106 cells/50 μL). Western blotting was performed according to previously published protocols.20,21 Antibody-reactive proteins were detected with horseradish peroxidase-labeled sheep anti–rabbit, –mouse, and/or –goat Ig sera and enhanced chemiluminescence (Amersham). Proteins were analyzed in 4% to 15% SDS-PAGE (Bio-Rad) using reducing conditions. Monoclonal and polyclonal antibodies used were as follows: polyclonal rabbit sera anti–SHIP-1 from Millipore; polyclonal rabbit anti-C/EBPβ antibodies and polyclonal goat anti-actin antibodies from Santa Cruz Biotechnology; and mouse monoclonal anti-GRB2 antibodies from Santa Cruz Biotechnology.
All Western blot films were scanned with a Personal Densitometer SI (Molecular Dynamics) scanner, and protein expression bands were analyzed with Image Quant (Molecular Dynamics) software as follows: scanned bands were selected and analyzed in terms of quantity of the black hue. Results were displayed on graphics. Then the intensity values of the bands for the proteins of interest were divided by the intensity values of the normalizing bands. The ratios obtained this way were then compared.
Luciferase activity assay
A fragment of 584 basepairs of the mouse C/ebpβ 3′-untranslated region (UTR) and another one of 1295 basepairs of the mouse Ship 3′-UTR, both containing complementary sequences to mmu-MiR-155, were amplified from mouse genomic DNA and cloned in the luciferase pGL3 control vector (Promega) in the XbaI restriction site. These constructs were then used to synthesize a MiR-155 mutant seed, with the help of the Stratagene QuikChange XL Site-Directed Mutagenesis kit. The mutagenic primers used for Ship were as follows: 5′- GGTGGGTCCTGAGATGTTTTTAAAAAGCAAATAAGAAAACCATCGG- 3′ for the forward and 5′-CCGATGGTTTTCTTATTTGCTTTTTAAAAACATCTCAGGACCC-ACC-3′ for the reverse; for C/EBPβ the mutating primers were as follows: 5′- GTATATTTTGAGAACCTTTTCCGTTTCGAGCAAATAAGT-GAAGACA- 3′ for the forward and 5′- TGTCTTCACTTATTTGCTCGAAACGGAAAAGGTTCTCAAAATATAC-3′ for the reverse. We used the same mutation as described by Vigorito et al.22 All mutations were confirmed by sequencing.
To test whether Ship is a target for miR-155, we cotransfected 293 cells using Lipofectamine 2000 (Invitrogen), as follows: 6 samples were transfected with 0.8 μg Ship 3′-UTR cloned in pGL3 control vector and 100 mM mmu-miR-155 precursor (Ambion), and 6 other samples with 0.8 μg Ship 3′-UTR cloned in pGL3 control vector and 100 mM miR negative control I (Ambion) instead of miR-155. We also cotransfected 6 samples with 0.8 μg mutant Ship 3′-UTR and 100 mM mmu-miR-155, and 6 samples with 0.8 μg mutant Ship 3′-UTR and 100 mM miR negative control I instead of miR-155 (Ambion); the same experiment was run for CEBPβ. All wells were also transfected with 0.05 μg/well control Renilla luciferase vector pRL-TK (Renilla luciferase; Promega). Cells were lysed after 24 hours and analyzed for luciferase and Renilla luciferase activities using the Dual Luciferase Reporter Assay kit (Promega) on a GLOMAX (Promega) microplate luminometer.
TaqMan assays
TaqMan assays were run in triplicate with mouse miR-155 TaqMan probe (Applied Biosystems) and 1× Universal Master Mix in 20 μL final volume on Bio-Rad ICycler under universal cycling conditions. RNA was extracted with TRIzol (Invitrogen). Expression was normalized to sno-RNA-135, and fold changes were calculated by q-ΔCt method.23
TargetScan
TargetScan (Whitehead Institute for Biomedical Research) predicts biologic targets of miRNAs based on the search for the presence of conserved 8-basepair and 7-basepair sites that match the seed region of each miRNA.24 The program also identifies sites with mismatches in the seed region that are compensated by conserved 3′ pairing.25 Predictions in mammals are ranked based on the predicted targeting efficacy as calculated using the context scores of the sites.26
Results
Eμ/VH miR-155 transgenics of both strains (FVB and C57BL/6) develop leukemias/lymphomas transplantable into syngeneic mice
MiR-155 transgenic mice were generated, as previously described.9 We expanded the colony to 500 transgenics and observed it for more than 2 years.
As reported, all transgenics display enlarged spleens as early as 3 to 4 weeks of age; some of them start showing clinical signs of malignant disease at 4 to 6 months (supplemental Figure 1A-C); however, we noted that more often the onset of the disease was at 9 months; in most cases, the mice were dead before 1 year of age (see survival chart, supplemental Figure 1A).
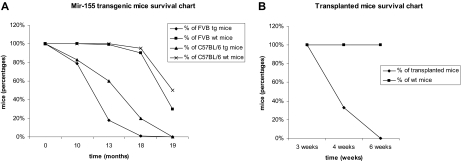
Malignant lymphocytes from both strains were isolated from leukemic spleens (supplemental Figure 1D) and injected in 40 syngeneic mice that started to show signs of disease (ruffled fur, hunched posture; see supplemental Figure 1C) approximately 4 weeks after the injection (see survival chart for the FVB strain transplants in Figure 1B; the C57BL/6 exhibited a very similar profile; data not shown); the leukemias in the syngeneic mice were clinically, histologically, and immunohistochemically identical to the primary ones. There were some differences between the FVB (400 mice taken into the study) and C57BL/6 transgenic mice (∼100 mice considered for our study) in terms of the phenotype exhibited. The FVB transgenics got sick slightly earlier (by 13 months, only 26% of the group was still alive; see survival chart, Figure 1A) and presented from a very early age an important increase in the size of the spleen, whereas the C57BL/6 initially had a less prominent splenomegaly and presented signs of disease a few months later than the FVB mice (60% of the group was alive at 13 months, and 20% at 18 months; see survival chart, Figure 1A).
Figure 1.
Comparative Kaplan Meier survival curve for MiR-155 transgenic mice. (A) Survival of FVB and C57BL/6 MiR-155 transgenics compared with their wild-type counterparts, showing shorter lifespan for the transgenic mice. (B) Survival of transplanted FVB mice compared with the wild-type controls; all transplanted mice were dead after 6 weeks, whereas all the wild-type controls were alive.
Leukemias in the miR-155 transgenic mice have a mixed B220low/IgM−/IgD− and IgM+/IgD+ phenotype
Histologically, the transgenic spleens exhibited the effacement of their architecture by a diffuse lymphoid proliferation composed mainly of large cells with marked atypia and numerous atypical mitoses. This lymphoproliferation was also present extensively in the bone marrow with the complete obliteration of their histology, and in a significant number of cases also in other organs (eg, mouse no. 764 showed extended liver infiltration, whereas mouse no. 384 had a widespread infiltration in both kidneys and liver). All sick mice exhibited marked lymphadenopathy.
Spleens, livers, and lymph nodes of sick mice immunohistochemically stained showed marked lymphoproliferation positive for pre–B-cell immunomarkers, such as CD20 and CD79a, and negative for T-cell markers, such as CD3 (data not shown). The proliferating lymphocytes also stained positively for μ intracytoplasmic chains and negative for surface IgM (data not shown). κ and λ chains were also absent.
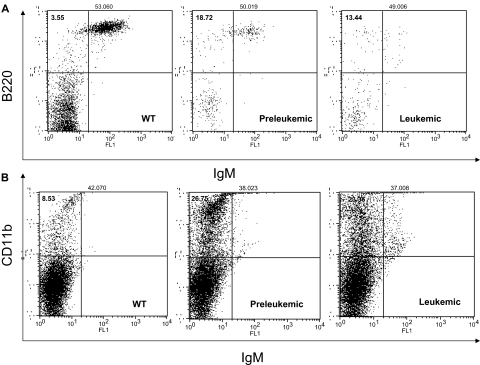
The flow cytometry showed an increase in the pre–B-cell population of approximately 7.45% plus or minus 0.14% (marked B220+/IgM−) in the preleukemic mice, whereas the leukemic cells exhibited a mixed phenotype B220low/IgM− and B220low/IgM+ (see Figure 2A). The percentages of B and pre-B cells did not change when we marked them for CD19 and IgD instead of B220 and IgM (data not shown). The T-cell population was diminished in all transgenics in various degrees of 5% to 30% (supplemental Figure 2). The T helper cell 1 population stained CD4+ and IL-2+ was unchanged (data not shown). Surprisingly enough, the myeloid line (CD11b+) was also increased in the transgenics (to 16.52% ± 2.4%) compared with the wild-types (Figure 2B).
Figure 2.
MiR-155 preleukemic transgenic mice are characterized exclusively by an expansion of the pre–B-cell population, whereas the MiR-155–induced leukemias display a mixed B220low/IgM− and B220low/IgM+ immunophenotype. The myeloid lineage was equally expanded in all transgenics, preleukemic and leukemic alike. (A) Flow cytometry for B220 and IgM shows an increase of the B220+/IgM− population in the preleukemic spleens compared with the wild-type ones; the leukemic spleens exhibit a mixed B220low/IgM+ and B220low/IgM− immunophenotype. (B) Flow cytometry for CD11b shows an important increase of the myeloid lineage in the transgenic spleens (preleukemic and leukemic) compared with the wild-types.
TaqMan assay detected the highest levels of miR-155 transgene expression in the bone marrow and the B-cell precursors
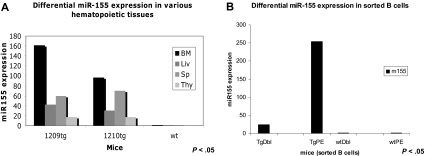
TaqMan assay was used to quantify the miR-155 transgene expression in various hematopoietic organs as well as in different flow cytometry-sorted B-cell subpopulations. We identified miR-155 to be more expressed in the bone marrow (∼ 2.5 times more) compared with the spleen, a possible indication of the preferential transcription of this transgene in the precursor rather than the mature lymphoid cells (see Figure 3A). The splenocytes of leukemic, preleukemic, and wild-type mice were sorted by flow cytometry in 2 subpopulations: pre-B (B220+/IgM−) and mature B (B220+/IgM+) cells. TaqMan assay performed on RNA extracted from these 2 cell populations indicated miR-155 transgene to be approximately 10 times more expressed in the precursors (B220+/IgM−) compared with the mature lymphocytes (B220+/IgM+; Figure 3B).
Figure 3.
MiR-155 transgene is differentially expressed in various hematopoietic organs and B-cell subpopulations, as assessed by TaqMan assay. (A) TaqMan assay showed that MiR-155 has the highest expression in the bone marrow (BM = bone marrow; Liv = liver; Sp = spleen; Thy = thymus). Note: Tg1 belongs to the founding line F8, whereas tg2 belongs to the founding line F10. (B) TaqMan assay indicated that MiR-155 transgene is much more expressed in the pre-B cells than in the mature B ones (TgDbl = transgenic mature B cells; TgPE = transgenic pre-B cells; wtDbl = wild-type mature B cells; wtPE = wild-type pre-B cells). Note: Cells were sorted from transgenics belonging to the same founding line, F8.
Southern blot for the VDJ rearrangement reveals the oligo/monoclonality of the malignant lymphoid population
Southern blot on diseased splenocytes for the VDJ rearrangement of IgH chains (to assess the clonality) showed oligo- and monoclonal rearranged bands (supplemental Figure 3A-B). In supplemental Figure 3A (in which the sick splenocyte genomic DNA was digested with PvuII), mouse no. 312 (lane 1) exhibited one extra band of 4 kb, whereas mouse no. 764 (lane 4) had 2 rearranged bands, of 6 kb and 10 kb, respectively (see black arrows, supplemental Figure 3A); 5-kb bands represent the germline heavy chain locus (see red arrow in supplemental Figure 3A); an additional faint band of 3 kb observed in all samples is a cross-hybridization band (see blue arrow in supplemental Figure 3A). Because the intensity of the germline bands is much stronger than that of the rearranged bands, it is quite likely that the disease for the most part is polyclonal, with the emergence of one or few dominant clones. In supplemental Figure 3B (in which the genomic DNA was digested with EcoRI), there is a case of leukemia with a rearranged band of approximately 8 kb (lane 3, red asterisk) of equal intensity to that of the germline that is of approximately 6 kb (blue asterisk), suggesting that this lymphoproliferation is monoclonal.
MiR-155 targets SHIP and C/EBPβ, 2 negative regulators of IL-6 lymphoid signaling pathway
SHIP (Inpp5d) is a phosphatase differentially expressed in B-cell precursors11; Ship−/− knockout mice display a block in B-cell differentiation at the pre-BI stage, whereas Ship−/− splenocytes have an enhanced proliferative responsiveness to cytokine stimulation. They also exhibit prolonged survival and increased viability, supposedly due to the activation of PI3K/AKT and MAPK pathways.11 Ship is a predicted target for MiR-155 (TargetScan; see “TargetScan”) and has at least one site of perfect complementarity with the seed of this microRNA in its 3′-UTR sequence (supplemental Figure 4).
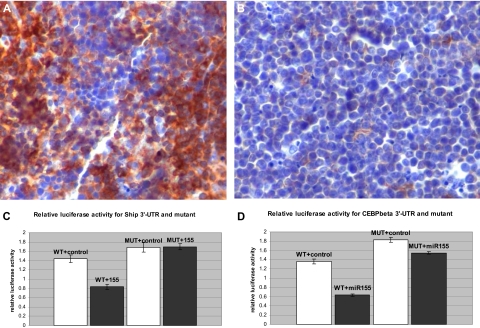
We hypothesized that Ship expression could be under the control of MiR-155 and thus down-regulated in the transgenic B-cell precursors. Immunohistochemical staining of leukemic spleens indicated a sharp reduction of SHIP expression in MiR-155 transgenic leukemias (Figure 4A-B), confirming that, indeed, Ship is down-regulated in the context of MiR-155 overexpression.
Figure 4.
Ship and C/ebpβ are direct targets of miR-155. (A) Spleen, immunohistochemistry, 200×. SHIP-1 is highly expressed in normal B and T lymphocytes (Olympus BX41 microscope and software; the bar represents 200 μm). (B) Malignant lymphocytes do not stain for SHIP-1 due to the loss of its expression. (C-D) Luciferase activity assay for Ship-3′-UTR and C/ebpβ, wild-type and mutant, after the control (□) and miR-155 (■) transfections in 293 cells.
To confirm that Ship is a direct target of MiR-155, a fragment of the Ship 3′-UTR containing the binding seed sequence for MiR-155 was cloned into the luciferase reporter plasmid pGL3, and cotransfected in 293 cells, together with a miR-155 mimic. The relative luciferase activity decreased by 42% in the presence of the miR-155 mimic compared with the control (see Figure 4C). The repressive effect of miR-155 was abolished in the presence of the mutated 3′-UTR, demonstrating the direct interaction between the microRNA and the binding site. Thus, Ship is a direct target of miR-155 and, therefore, we expect its expression to be reduced in the Eμ-miR-155 B lymphocytes.
C/EBPβ acts as a negative regulator of the IL-6–related signaling pathway in B cells; on the other hand, IL-6 phosphorylates MAPK that activate C/EBPβ.13 C/ebpβ is a predicted direct target of MiR-155 (TargetScan; see supplemental Figure 5).
To verify whether this is biologically true, luciferase activity assays were performed on 293 cells cotransfected with C/ebpβ 3′-UTR, cloned in the luciferase reporter pGL3 vector, and a miR-155 mimic; we recorded a decrease of approximately 53% of the relative luciferase activity in the presence of the miR-155 mimic compared with the control (Figure 4D); after mutating 3 bases in the 3′-UTR seed sequence, this decrease was only of approximately 14%, indicating that the binding site is operational. Therefore, C/ebpβ is a direct target of miR-155, and we expect it to be diminished in the MiR-155 transgenic B cells.
SHIP and C/EBPβ present lower expression in the leukemic lymphocytes
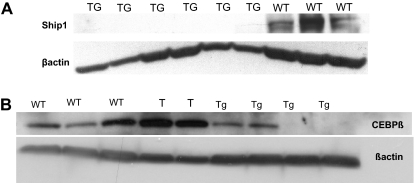
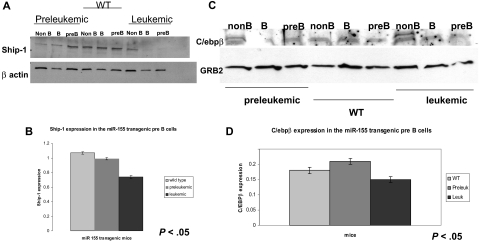
Western blot analysis on protein extracts from leukemic and wild-type total splenocytes (Figure 5A) indicated that SHIP was absent in the transgenic samples, whereas C/EBPβ was not expressed in 2 transgenics and had diminished levels in 2 others (Figure 5B). Interestingly, 2 T-cell leukemias arisen in the MiR-155 transgenics had normal levels of CEPB/β (Figure 5B; the T-cell leukemia samples are marked with “T”). To study the correlation between SHIP and C/EBPβ expression level and the degree of malignant lymphoid transformation, we sorted 3 spleen subpopulations by flow cytometry, as follows: immature B cells (B220+IgM−), mature B cells (B220+, IgM+), and non-B cells (B220−IgM−). We then assessed SHIP and C/EBPβ expression by Western blot in all these 3 subpopulations in the preleukemic, leukemic, and wild-type mice (Figure 6A-D). Densitometry on the SHIP expression bands in the pre-B cells indicated that this protein is the least expressed in the leukemic mice, less expressed in the preleukemic, and the most expressed in the wild-type mice (Figure 6A-B). The mature B cells displayed the same gradual reduction of the SHIP expression, ranging from the best expressed in the wild-type to the least expressed in the leukemic. C/EBPβ, on the other hand, did not seem to be less expressed in the preleukemic compared with the wild-type pre-B cells. However, the leukemic pre-B cells exhibited decreased levels of C/EBPβ compared with both the wild-type and preleukemic, as shown by the densitometric analysis of the protein bands on the immunoblot (Figure 6C-D). Unlike SHIP, C/EBPβ seems to maintain the same low level of expression in all mature B cells, without any significant difference between the wild-type, preleukemic, and leukemic mice (Figure 6C). Western blot on the same subpopulations of B cells failed to identify any expression of IL-6, indicating that, most likely, the IL-6 intracellular pathway and not the IL-6 transcription is influenced by SHIP and C/EBPβ down-regulation (data not shown).
Figure 5.
The Ship and C/ebpβ down-regulation in the miR-155 transgenic splenocytes compared with the wild-type splenocytes occurs mainly in the B-cell precursors rather than in the mature B cells. (A-B) Western blots on proteins extracted from total splenocytes show the lack of expression of SHIP-1 (A) and C/EBPβ (B) in the leukemic compared with the wild-types. Note: The samples marked “T” are 2 T-cell leukemias arisen in the miR-155 transgenic mice.
Figure 6.
Western blots on flow cytometry-sorted B cells for SHIP and C/ebpβ show that miR-155 leukemic pre-B cells have lower expression of these 2 proteins compared with the wild-type counterparts. (A) Immunoblot shows a stepwise down-regulation of the SHIP expression in the pre-B and mature B cells in the leukemic sorted cells compared with their preleukemic and wild-type counterparts. (B) Densitometry for SHIP expression in pre-B cells calculated on the previous immunoblot confirms that SHIP is expressed the most in the wild-type, less in the preleukemic, and the least in the leukemic cells. (C) Immunoblot on sorted splenocytes shows a down-regulation of C/ebpβ in the pre-B cells of leukemic mice compared with their preleukemic and wild-type counterparts. (D) Densitometry for the C/ebpβ expression in different pre-B cells (wild-type, preleukemic, and leukemic), calculated on the previous immunoblot, confirms that C/ebpβ has higher expression in the leukemic pre-B cells than in the preleukemic and wild-type ones.
Discussion
The Eμ-MiR-155 mice were followed up for approximately 2 years. All transgenic mice developed polyclonal lymphoproliferation, followed by malignant leukemias and lymphomas. All leukemias were transplantable into syngeneic mice with a latency of 1 to 1.5 months. There were only minor differences between the 2 strains (FVB and C57BL/6) in the sense in which C57BL/6 exhibited a slightly longer latency and a milder onset of the disease. Immunohistochemistry showed the malignant lymphoproliferation to be composed of B-cell precursors B220+/CD79a+ and IgM−, irrespective of the strain. Flow cytometry unveiled a more nuanced picture: we, thus, could see that initially the lymphoproliferation was with B220+/IgM−/IgD− cells, whereas the mature B-cell population did not seem to be affected; in the leukemic mice, however, most of the B cells had diminished expression of the surface antigen B220 (becoming B220low), and many of them did not display IgM or IgD. The B220+/IgM+ mature population was drastically diminished in the leukemic spleens compared with the preleukemic ones. All transgenics showed an unexpected and consistent increase of the myeloid lineage. T-cell population was variably decreased in all transgenics compared with the wild-type mice. TaqMan showed MiR-155 transgene to be expressed at higher levels in the bone marrow compared with the spleen. The pre-B cells exhibited the highest levels of MiR-155 expression. VDJ rearrangement analyses of malignant splenocytes revealed the existence of rearranged bands consistent with the emergence of dominant clones. Noteworthily, Ship−/− knockout mice present a block in the B-cell differentiation at the stage of pre-BI (lymphoblast), similar to the MiR-155 transgenic mice, together with a decrease of the bone marrow mature B lymphocytes. Ship is known to be differentially expressed in the pro- and pre-B stages of B-cell maturation.11 Recently, Nakamura et al demonstrated that the B-cell–defective development in Ship−/− mice is due to exogenous IL-6 signaling pathway activation. Experiments with IL-6 recombinant in stromal-free cultures of wild-type bone marrow cells show that this proinflammatory cytokine acts on hematopoietic cells and promotes myelopoiesis while suppressing B lymphoid development.27 This suggests that SHIP has an important role in the early stages of B lymphoid development, and its action might be due in part to the suppression of the IL-6–initiated cell signaling. Interestingly, Helgason et al demonstrated that Ship−/− B cells have an increased phosphorylation and activation of MAPK and AKT, and consequently, are resilient to apoptosis and show a prolonged survival.11 Moreover, splenocytes from double-knockout mice for PTEN−/− and Ship−/− have even lower apoptotic rates and longer survival than Ship−/− single mutants, demonstrating that, indeed, SHIP is an inhibitor of the AKT pathway.28 The luciferase assays performed by us indicated that Ship is down-regulated by miR-155. Recently, other groups also have identified Ship as a target of miR-155.29,30 O'Connell et al showed that repression of Ship by miR-155 might be at the origin of the myeloproliferative disorder phenotype expressed by hematopoietic MiR-155–overexpressing mice.29 Moreover, Pedersen et al determined that MiR-155–SHIP interaction is part of the tumor necrosis factor–dependent B-cell lymphoma growth pathway.30 Immunhistochemical staining showed the absence of Ship expression in the MiR-155–related murine leukemias. Western blot on total splenocytes found SHIP to be drastically decreased in transgenics compared with wild-types. Western blot on flow cytometry-sorted B cells showed SHIP to be down-regulated mainly in the pre-B and mature B cells. The Eμ/VH promoter/enhancer is activated at the early pre-B stage (pre-BI). We think that once MiR-155 transgene is overexpressed in the B-cell lineage, SHIP levels diminish drastically, resulting in a block of the B-cell differentiation at the pre-BI stage. In these SHIP-deficient B-cell precursors, PI3K/AKT and MAPK remain activated. Thus, the incompletely differentiated lymphocytes fail to undergo apoptosis. Instead, they survive and accumulate. This causes the initial polyclonal lymphoproliferation that we find in all of our transgenics. Ulteriorly, this lymphoproliferation becomes oligo/monoclonal and displays a mixed immunophenotype of B220low/IgM− and B220low/IgM+ cells, due to the partial loss of B220 surface antigen by the malignant B cells. Another protein down-regulated by miR-155 is C/EBPβ, also known as a negative regulator of the IL-6 signaling pathway.18 In B cells, C/EBPβ is activated by the MAPK after their phosphorylation by exogenous IL-6.13 Both the C/ebpβ knockout and IL-6 transgenic mice (that overexpress this protein in all hematopoietic cells) mimic an aggressive form of human Castleman disease characterized by polyclonal hypergammaglobulinemia and plasma cell hyperplasia.18,31 The inactivation of the IL-6 gene in T cells reverses the abnormal B and plasma cell expansion of the Cebpβ−/− mice, supposedly by lack of induction of the IL-6–dependent B-cell signaling pathway.32
Similar to the C/ebpβ−/− mice and IL-6 transgenics, the CD21cre-MiR-155 knockin mice presented an augmentation of the IgG1-synthesizing cells in spleen and lymph nodes.6 The phenotype of both MiR-155 knockout and knockin mice seems to suggest that MiR-155 could cause an accelerated B-cell maturation and increased IgG1 cell accumulation at later stages of B-cell differentiation; this could occur in humans as well, because up-regulation of MiR-155 is commonly observed in diffuse large B-cell lymphoma, especially in the ABC subtype (with activated mature B cells)7; Vigorito et al recently suggested that one possible mechanism for the MiR-155 role in the B lymphocyte maturation might be down-regulation of PU.1.22 We believe that MiR-155 regulates the IL-6–mediated signaling pathway (implicated in B-cell differentiation) by targeting C/EBPβ. The down-regulation of C/EBPβ causes an IL-6–dependent accumulation of IgG1-positive cells in the knockin MiR-155 murine model, similar to the PU.1 down-modulation. A deletion of human chromosome 20q in the region where C/EBPβ maps has been reported in several cases of myeloproliferative disorders and myelodisplastic syndromes, suggesting that this gene could be a link between myelo- and lymphoproliferative disorders.21 Interestingly enough, the MiR-155 transgenic mice also exhibit invariably an increase of the myeloid lineage. We were able to demonstrate by luciferase assay experiments that C/EBPβ is a direct target of miR-155. Two different groups, O'Connell et al33 and Yin et al,34 have also recently shown that C/EBPβ is directly regulated by miR155. Western blot on total splenocytes indicated a decrease of the C/EBPβ expression in 2 of our transgenic samples and its total abolition in 2 more others. The immunoblot on sorted splenocytes from wild-type, preleukemic, and leukemic animals indicated that, whereas there was no relevant difference in terms of C/EBPβ expression between the various mature B cells, leukemic pre-B cells were exhibiting obviously decreased levels of C/EBPβ compared with the wild-type and leukemic B-cell precursors. We concluded that C/EBPβ down-regulation, similar to that of SHIP, is one of the early events induced by the MiR-155 overexpression occurring at the pre-BI stage. We believe that in the absence of C/EBPβ, cells proliferate faster in preparation for a differentiation that does not occur anymore due to the Ship down-regulation.
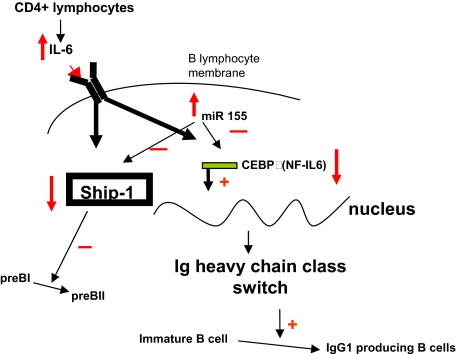
In conclusion, we show that MiR-155 transgene expression reaches its peak at the pre–B-cell stage. High levels of MiR-155 down-regulate Ship and free the IL-6 pathway of its inhibitory control, generating a block in the B-cell differentiation and favoring the accumulation of predominantly apoptosis-resistant pre-BI cells. This initiates the leukemogenesis, malignant Ship-deficient lymphocytes proliferating preferentially over the ones that still maintain some Ship expression, as shown by the gradual decrease in intensity of the SHIP synthesis in leukemic pre-B cells compared with preleukemic ones. MiR-155 overexpression also down-modulates C/EBPβ, liberating the IL-6–dependent signaling pathway of another inhibitory control. This also contributes to the lymphoproliferation identified in the MiR-155 transgenic mice (Figure 7).
Figure 7.
Schematic presentation of the proposed IL-6–SHIP–C/EBPβ–MiR-155 interactions in B cells, and their role in lineage differentiation.
Supplementary Material
Acknowledgment
This work was supported in part by research funding to C.M.C. by the National Institutes of Health (Grant 5R01CA124541, “Role of miR155 in Leukemogenesis”).
Footnotes
The online version of this article contains a data supplement.
The publication costs of this article were defrayed in part by page charge payment. Therefore, and solely to indicate this fact, this article is hereby marked “advertisement” in accordance with 18 USC section 1734.
Authorship
Contribution: S.C. and S.K.S. designed research, performed research, analyzed data, and wrote the paper; C.M.C. designed research, analyzed data, and wrote the paper; I.M.P. designed research; and E.T., R.T., D.P., D.C., P.N., J.H., L.R.K., and A.S. performed research.
Conflict-of-interest disclosure: The authors declare no competing financial interests.
Correspondence: Carlo Maria Croce, Comprehensive Cancer Center, Molecular Virology, Immunology, and Medical Genetics, 460 West 12th Ave, Columbus, OH 43210; e-mail: carlo.croce@osumc.edu.
References
- 1.Calin GA, Croce CM. MicroRNA signatures in human cancers. Nat Rev Cancer. 2006;6:857–866. doi: 10.1038/nrc1997. [DOI] [PubMed] [Google Scholar]
- 2.Calin GA, Ferracin A, Cimmino A, et al. A microRNA signature associated with prognosis and progression in chronic lymphocytic leukemia. N Engl J Med. 2006;353:1793–1801. doi: 10.1056/NEJMoa050995. [DOI] [PubMed] [Google Scholar]
- 3.Volinia S, Calin GA, Liu CG, et al. A microRNA expression signature of human solid tumors defines cancer gene targets. Proc Natl Acad Sci U S A. 2006;103:2257–2261. doi: 10.1073/pnas.0510565103. [DOI] [PMC free article] [PubMed] [Google Scholar]
- 4.Calin GA, Dumitru CD, Shimizu M, et al. Frequent deletions and down-regulation of microRNA genes miR15 and miR16 at 13q14 in chronic lymphocytic leukemia. Proc Natl Acad Sci U S A. 2002;99:15524–15529. doi: 10.1073/pnas.242606799. [DOI] [PMC free article] [PubMed] [Google Scholar]
- 5.Iorio MV, Ferracin M, Liu CG, et al. MicroRNA gene expression deregulation in human breast cancer. Cancer Res. 2005;65:7065–7070. doi: 10.1158/0008-5472.CAN-05-1783. [DOI] [PubMed] [Google Scholar]
- 6.He L, Thomson JM, Hemann MT, et al. A microRNA polycistron as a potential human oncogene. Nature. 2005;435:828–833. doi: 10.1038/nature03552. [DOI] [PMC free article] [PubMed] [Google Scholar]
- 7.Eis PS, Tam W, Sun L, et al. Accumulation of miR-155 and BIC RNA in human B cell lymphomas. Proc Natl Acad Sci U S A. 2005;102:3627–3632. doi: 10.1073/pnas.0500613102. [DOI] [PMC free article] [PubMed] [Google Scholar]
- 8.Kluiver J, Poppema S, de Jong D, et al. BIC and miR-155 are highly expressed in Hodgkin, primary mediastinal and diffuse large B cell lymphomas. J Pathol. 2005;207:243–249. doi: 10.1002/path.1825. [DOI] [PubMed] [Google Scholar]
- 9.Costinean S, Zanesi N, Pekarsky Y, et al. Pre-B cell proliferation and lymphoblastic leukemia/high-grade lymphoma in E[μυ]-miR-155 transgenic mice. Proc Natl Acad Sci U S A. 2006;103:7024–7029. doi: 10.1073/pnas.0602266103. [DOI] [PMC free article] [PubMed] [Google Scholar]
- 10.Nakamura K, Malykhin A, Coggeshall KM. The Src homology 2 domain-containing inositol 5-phosphatase negatively regulates Fcγ receptor-mediated phagocytosis through immunoreceptor tyrosine-based activation motif-bearing phagocytic receptors. Blood. 2002;100:3374–3382. doi: 10.1182/blood-2002-03-0787. [DOI] [PubMed] [Google Scholar]
- 11.Helgason CD, Kalberer CP, Damen JE, et al. A dual role for Src homology 2 domain-containing inositol-5-phosphatase (SHIP) in immunity: aberrant development and enhanced function of B lymphocytes in Ship−/− mice. J Exp Med. 2000;191:781–794. doi: 10.1084/jem.191.5.781. [DOI] [PMC free article] [PubMed] [Google Scholar]
- 12.Liu Q, Oliveira-dos-Santos AJ, Mariathasan S, et al. The inositol polyphosphate 5-phosphatase SHIP is a crucial negative regulator of B cell antigen receptor signaling. J Exp Med. 1998;188:1333–1342. doi: 10.1084/jem.188.7.1333. [DOI] [PMC free article] [PubMed] [Google Scholar]
- 13.Nakajima T, Kinoshita S, Sasagawa T, et al. Phosphorylation at threonine-235 by a ras-dependent mitogen-activated protein kinase cascade is essential for transcription factor NF-IL6. Proc Natl Acad Sci U S A. 1993;90:2207–2211. doi: 10.1073/pnas.90.6.2207. [DOI] [PMC free article] [PubMed] [Google Scholar]
- 14.Trautwein C, Caelles C, van der Geer P, et al. Transactivation by NF-IL6/LAP is enhanced by phosphorylation of its activation domain. Nature. 1993;364:544–547. doi: 10.1038/364544a0. [DOI] [PubMed] [Google Scholar]
- 15.Cooper C, Johnson D, Roman C, Avitahl N, Tucker P, Calame K. The C/EBP family of transcriptional activators is functionally important for Ig VH promoter activity in vivo and in vitro. J Immunol. 1992;149:3225–3231. [PubMed] [Google Scholar]
- 16.Natsuka S, Akira S, Nishio Y, et al. Macrophage differentiation-specific expression of NF-IL6, a transcription factor for interleukin-6. Blood. 1992;79:460–466. [PubMed] [Google Scholar]
- 17.Scott LM, Civin CI, Rorth P, Friedman AD. A novel temporal expression pattern of three C/EBP family members in differentiating myelomonocytic cells. Blood. 1992;80:1725–1735. [PubMed] [Google Scholar]
- 18.Screpanti I, Romani L, Musiani P, et al. Lymphoproliferative disorder and imbalanced T-helper response in C/EBPβ-deficient mice [Errata published in EMBO J 1995;14:3596]. EMBO J. 1995;14:1932–1941. doi: 10.1002/j.1460-2075.1995.tb07185.x. [DOI] [PMC free article] [PubMed] [Google Scholar]
- 19.Thai TH, Calado DP, Casola S, et al. Regulation of the germinal center response by microRNA-155. Science. 2007;316:604–608. doi: 10.1126/science.1141229. [DOI] [PubMed] [Google Scholar]
- 20.Trotta R , Parihar R, Yu J, et al. Differential expression of SHIP1 in CD56bright and CD56dim NKcells provides a molecular basis for distinct functional responses to monokine co-stimulation. Blood. 2005;105:3011–3018. doi: 10.1182/blood-2004-10-4072. [DOI] [PubMed] [Google Scholar]
- 21.Guerzoni C, Bardini M, Mariani SA, et al. Inducible activation of C/EBPβ, a gene negatively regulated by BCR/ABL, inhibits proliferation and promotes differentiation of BCR/ABL-expressing cells. Blood. 2006;107:4080–4089. doi: 10.1182/blood-2005-08-3181. [DOI] [PMC free article] [PubMed] [Google Scholar]
- 22.Vigorito E, Perks KL, Abreu-Goodger C, et al. MicroRNA-155 regulates the generation of immunoglobulin class-switched plasma cells. Immunity. 2007;27:847–859. doi: 10.1016/j.immuni.2007.10.009. [DOI] [PMC free article] [PubMed] [Google Scholar]
- 23.Schmittgen TD, Livak KJ. Analyzing real-time PCR data by the comparative CT method. Nat Protoc. 2008;3:1101–1108. doi: 10.1038/nprot.2008.73. [DOI] [PubMed] [Google Scholar]
- 24.Lewis BP, Burge CB, Bartel DP. Conserved seed pairing, often flanked by adenosines, indicates that thousands of human genes are microRNA targets. Cell. 2005;120:15–20. doi: 10.1016/j.cell.2004.12.035. [DOI] [PubMed] [Google Scholar]
- 25.Friedman RC, Farh KK-H, Burge CB, Bartel DP. Most mammalian mRNAs are conserved targets of microRNAs. Genome Res. 2009;19:92–105. doi: 10.1101/gr.082701.108. [DOI] [PMC free article] [PubMed] [Google Scholar]
- 26.Grimson A, Farh KK-H, Johnston WK, Garrett-Engele P, Lim LP, Bartel DP. MicroRNA targeting specificity in mammals: determinants beyond seed pairing. Mol Cell. 2007;27:91–105. doi: 10.1016/j.molcel.2007.06.017. [DOI] [PMC free article] [PubMed] [Google Scholar]
- 27.Nakamura K, Kouro T, Kincade PW, et al. Src homology 2-containing 5-inositol phosphatase (SHIP) suppresses an early stage of lymphoid cell development through elevated interleukin-6 production by myeloid cells in bone marrow. J Exp Med. 2004;199:243–254. doi: 10.1084/jem.20031193. [DOI] [PMC free article] [PubMed] [Google Scholar]
- 28.Moody JL, Xu L, Helgason CD, Jirik FR. Anemia, thrombocytopenia, leukocytosis, extramedullary hematopoiesis, and impaired progenitor function in Pten+/−SHIP−/− mice: a novel model of myelodysplasia. Blood. 2004;103:4503–4510. doi: 10.1182/blood-2003-09-3262. [DOI] [PubMed] [Google Scholar]
- 29.O'Connell RM, Chaudhuri AA, Rao DS, Baltimore D. Inositol phosphatase SHIP1 is a primary target of miR-155. Proc Natl Acad Sci U S A. 2009;106:7113–7118. doi: 10.1073/pnas.0902636106. [DOI] [PMC free article] [PubMed] [Google Scholar]
- 30.Pedersen IM, Otero DC, Kao E, et al. Onco-Mir-155 targets SHIP to regulate TNF-dependent B-cell lymphoma growth. Blood. 2008;112:604. [Google Scholar]
- 31.Brandt SJ, Bodine DM, Dunbar CE, Nienhuis AW. Dysregulated interleukin 6 expression produces a syndrome resembling Castleman's disease in mice. J Clin Invest. 1990;86:592–599. doi: 10.1172/JCI114749. [DOI] [PMC free article] [PubMed] [Google Scholar]
- 32.Screpanti I, Musiani P, Bellavia D, et al. Inactivation of the IL-6 gene prevents development of multicentric Castleman's disease in C/EBPβ-deficient mice. J Exp Med. 1996;184:1561–1566. doi: 10.1084/jem.184.4.1561. [DOI] [PMC free article] [PubMed] [Google Scholar]
- 33.O'Connell RM, Rao DS, Chaudhuri AA, et al. Sustained expression of microRNA-155 in hematopoietic stem cells causes a myeloproliferative disorder. J Exp Med. 2008;205:585–594. doi: 10.1084/jem.20072108. [DOI] [PMC free article] [PubMed] [Google Scholar]
- 34.Yin Q, McBride J, Fewell C, et al. MicroRNA-155 is an Epstein-Barr virus-induced gene that modulates Epstein-Barr virus-regulated gene expression pathways. J Virol. 2008;82:5295–5306. doi: 10.1128/JVI.02380-07. [DOI] [PMC free article] [PubMed] [Google Scholar]
Associated Data
This section collects any data citations, data availability statements, or supplementary materials included in this article.


