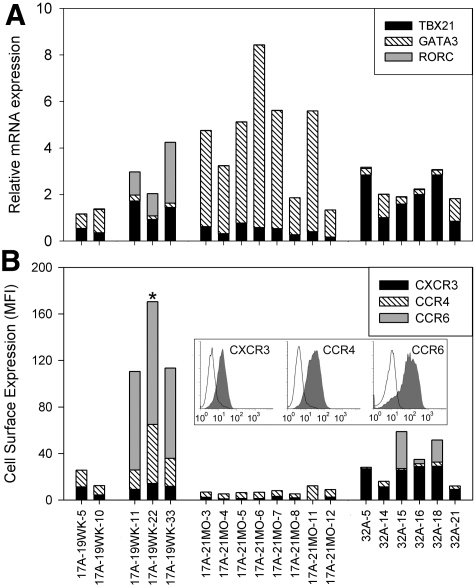
Figure 3.
Transcription factor mRNA and chemokine receptor expression for FVIII-specific T-cell clones. (A) TBX21, GATA3, and RORC mRNA expression in T-cell clones was quantified by real-time quantitative polymerase chain reaction using TaqMan gene expression assays. Expression levels were normalized to 18S rRNA expression. Mean values are shown for TBX21, GATA3, and RORC mRNAs, plotted as stacked bar graphs. Cycle threshold values were determined in triplicate for 2 to 3 samples of each clone. The samples were generated by separate expansions, except for T-cell clones 17A-19WK-10, -22, -33, 17A-21MO-12, and 32A-21, which were evaluated only once because they expanded poorly compared with the other clones. (B) CXCR3, CCR4, and CCR6 cell surface expression on T-cell clones was quantified by flow cytometry. The MFI indicating the specific antibody staining minus the isotype staining was calculated. Mean values from 2 to 3 independent experiments are shown, plotted as stacked bar graphs. Clones are grouped according to their cytokine secretion profiles. One example of the chemokine receptor-staining data is shown in the inset as a conventional histogram overlay (chemokine receptor antibodies, filled histogram; isotype control antibodies, open histogram) with fluorescent intensity plotted on the x-axis (logarithmic scale from 100 to 103 fluorescent units) and cell counts plotted on the y-axis, normalized as percentage of maximum (linear scale from 0%-100%). * indicates that the inset corresponds to clone 17A-19WK-22.

