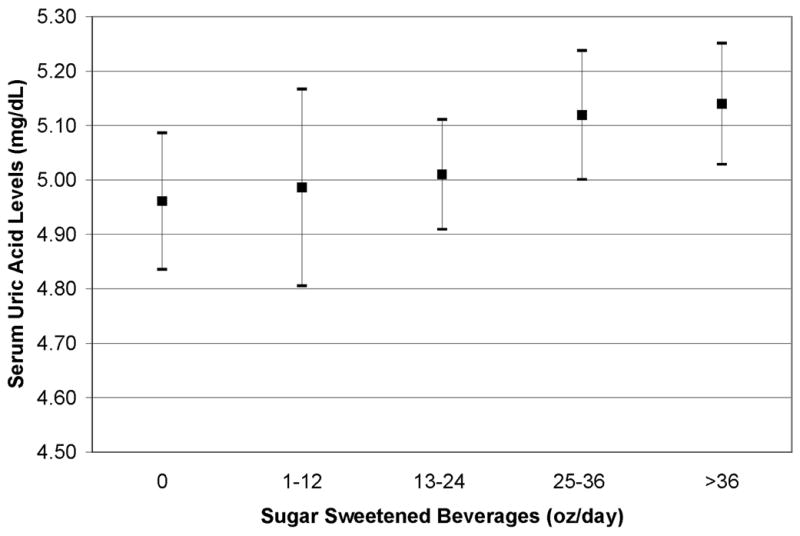
Figure 1.

Sample mean of serum uric acid with 95% confidence intervals by categories of sugar sweetened beverage consumption adjusted for age, race/ethnicity, sex, total calories, BMI z-score, alcohol, smoking, dietary fiber intake, diet beverage consumption, and milk consumption. P for trend = 0.01
