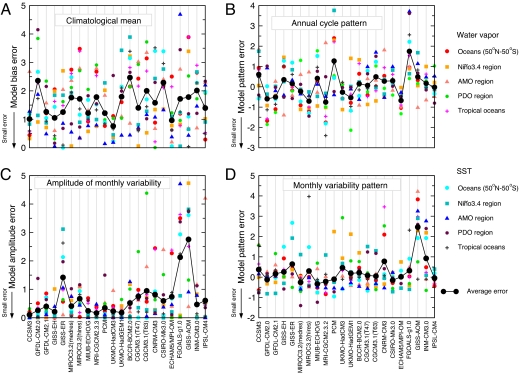
Fig. 2.
Results for four different sets of metrics used in the ranking of model performance. The statistics are measures of how well 22 of the models in the CMIP-3 database reproduce key features of observed water vapor and SST behavior in five different geographical regions. The metrics shown here are a subset of the full suite of metrics that we applied for model ranking, and are for the mean state (A), annual cycle pattern (B), amplitude of monthly variability (C), and pattern of monthly variability (D). For models with multiple 20CEN realizations, values of metrics are averaged over realizations. The black dots labeled “average error” represent the arithmetic average (for each model) of the 10 metric values (2 variables × 5 regions). (A and C) Small values of the normalized metrics indicate greater skill in simulating the mean state and the amplitude of monthly variability. (B and D) Negative values of the normalized pattern correlation metrics denote greater skill in simulating the annual cycle and monthly variability patterns.

