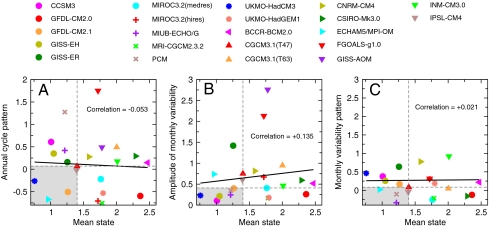
Fig. 3.
Relationship between model skill in simulating the mean state and skill in simulating the annual cycle pattern (A), amplitude of monthly variability (B), and monthly variability pattern (C). Results plotted are the “average errors” shown and described in Fig. 2. The black lines are the fitted least-squares regression lines. Models to the left of the vertical dashed gray line are ranked in the top 10 based on values of the mean state metric α̂. Models below the horizontal dashed gray line are ranked in the top 10 based on values of the annual cycle pattern metric β̂ (A), the variability amplitude metric φ̂ (B), and the variability pattern metric ϕ̂ (C). The gray shaded region indicates the intersection of the two sets of top 10 models plotted in each graph.

