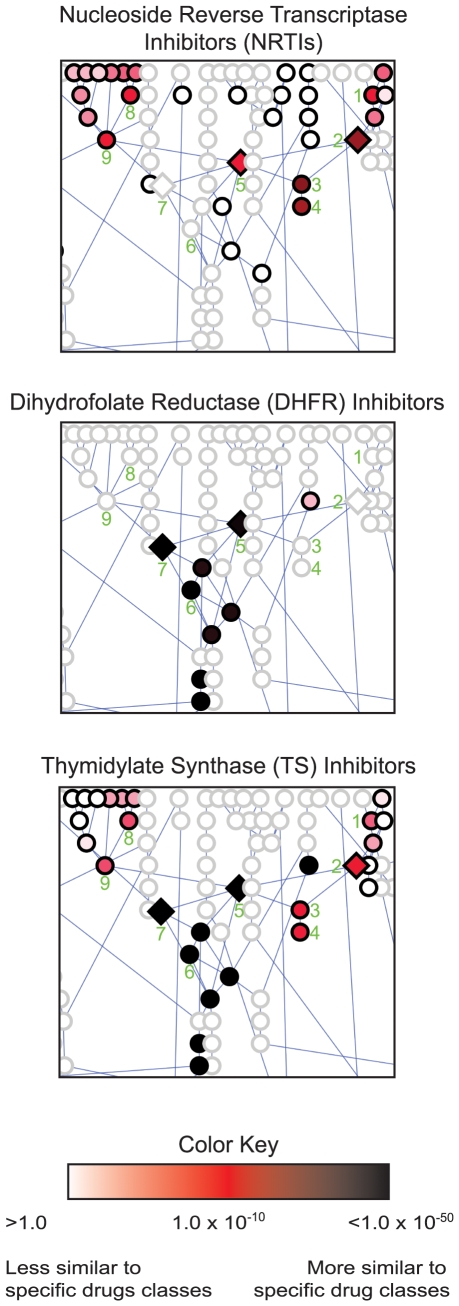
Figure 3. Effect-space map showing chemical similarity between specific drug classes and metabolites in human folate and pyrimidine biosynthesis.
Each node represents one reaction set – the substrates and products of a single human metabolic reaction. Edges connect the reactions in the canonical pathway as annotated in HumanCyc [35]. As given in the color key, each reaction is colored according to the expectation value indicating the strength of similarity between that target reaction set and the respective MDDR drug set. Diamond shaped nodes indicate reactions catalyzed by enzymes annotated as known drug targets in the MDDR; circles indicate reactions catalyzed by enzymes not annotated as targets. Reaction key: 1. Deoxyuridine kinase 2. Thymidine kinase 3. Thymidylate kinase 4. Deoxythymidine diphosphate kinase 5. Thymidylate synthase (TS) 6. Methylene tetrahydrofolate reductase 7. Dihydrofolate reductase (DHFR) 8. Deoxyuridine diphosphate kinase 9. Deoxyuridine triphosphate diphosphatase.

