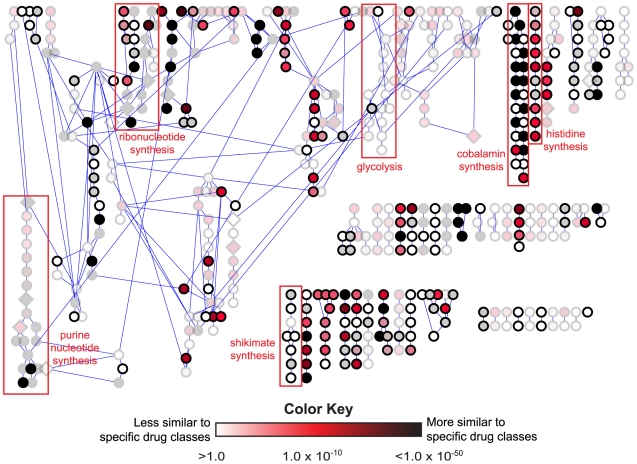
Figure 5. Effect-space map showing chemical similarity between drugs and metabolites in MRSA.
Canonical pathway representation of methicillin-resistant Staphylococcus aureus (MRSA) [12] small molecule metabolism colored by expectation value of the best hit against MDDR. Reactions that are also present in humans have been faded. Layout based upon the Cytoscape 2.5 y-files hierarchical layout. Edge lengths are not significant. For ease of viewing, reactions are not labeled but can be identified in the interactive versions of the maps available at the online resource.

