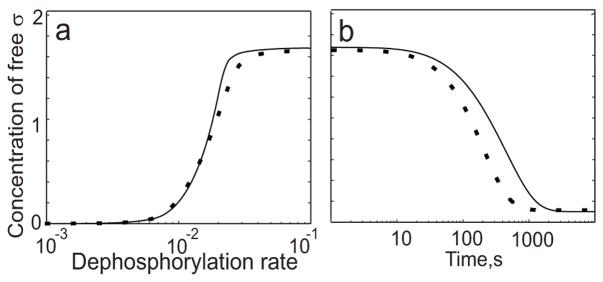
Fig. 3.
Comparison of σF networks with (solid line) and without (dotted line) dead-end complex formation using values that preclude hysteresis ([AA]=[AB]=6μM; [σF]=2μM). (a) Steady-state concentration of free sigma factor as a function of dephosphorylation rate. Under these conditions when [AA] is equal to [AB], the network with the dead-end complex possesses only one stable steady-state; the network without the complex performs similarly. (b) Dynamic response of free sigma factor to a step decrease in the rate of dephosphorylation (compare to Fig 2c).

