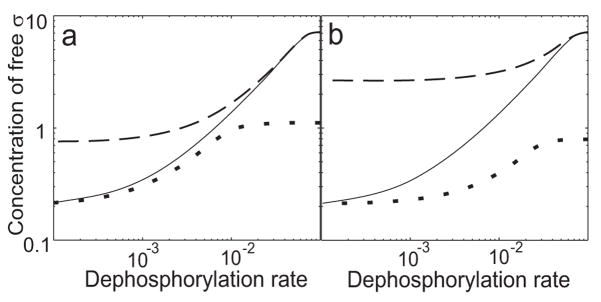
Fig. 6.
Removal of either positive autocatalytic loop affects steady state performance of the σB network. (a) Elimination of σB control of V expression leads to reduced regulatory capacity. The reference (wild-type) steady state response is shown by a solid line. Dashed and dotted lines correspond to maximum- and pre-stress levels of V expression, respectively. (b) Elimination of σB control of σB expression also leads to reduced regulatory capacity. Line designations are as in panel a, but here dashed and dotted lines correspond to maximum- and pre-stress levels of σB expression.

