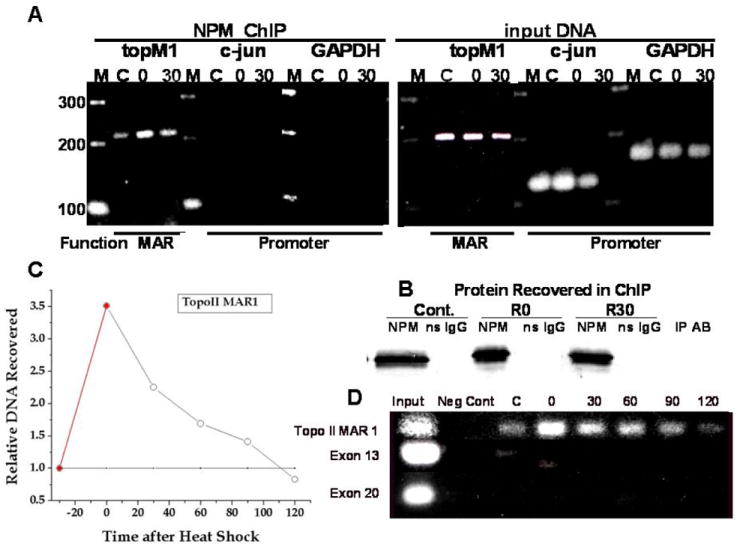
Figure 5. PCR reaction products from DNA associated with NPM.

(A) PCR results for the input DNA and that for the NPM-associated DNA recovered in the ChIP assay are indicated. Amplification of promoter sequences was detected in the input DNA but not in the DNA sequences co-immunoprecipitated with NPM. Control is marked “C”’ heated at 45°C for 30 min is “O” and 30 min after heat is “30”. NPM recovery is shown in (B). Immunoprecipitates from unheated control cells are marked C. Immunoprecipitates from heat shocked (30 min at 45°C) cells are indicated by numbers, i.e. 0 = 0 min and 30 =30 min after heat shock. After cells were heat shocked (45°C for 30 min) the CHIP assay was performed at the indicated time (D). Exon DNA was also analyzed. The relative change in NPM-Topo I MAR1 binding (open circles) and NPM-Topo I exon DNA (dotted line) is quantified (C).
