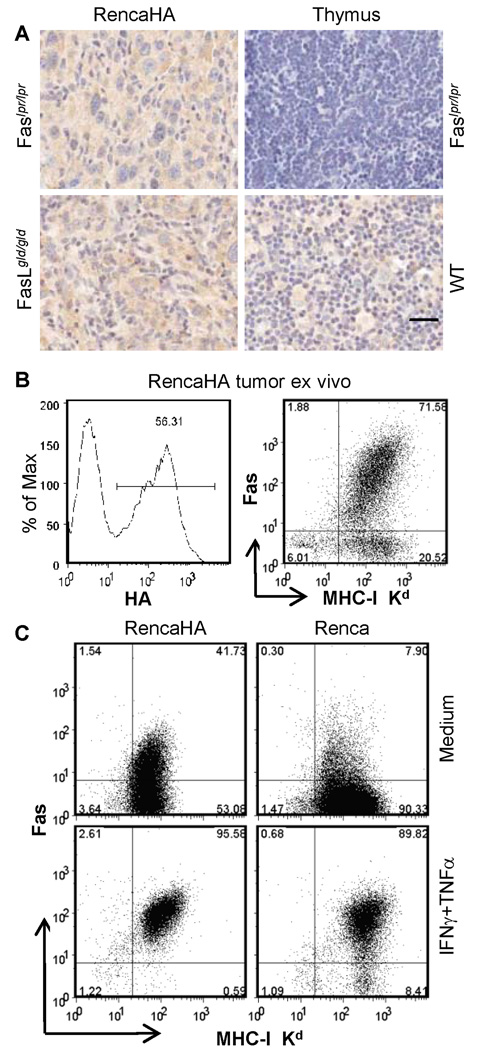
Figure 4. Renca-HA tumor cells express Fas in vivo.
(A) Fas (M-20)-stained sections (20× magnification) of Renca-HA solid tumors from Faslpr/lpr and FasLgld/gld mice, Faslpr/lpr thymus (negative control) and WT mice (positive control). Bar = 25 µm, all images. (B) Dot plots of Fas (Jo2) versus MHC class-I Kd (right panel) on gated HA+ cells (left panel) in the tumor cells isolated from day-12-established Renca-HA tumors in RAG2−/− mice. Numbers represent % positive cells. (C) Dot plots of Fas versus MHC class-I Kd (right panel) on Renca-HA or Renca tumor cells treated overnight with medium or with 500 U/ml of TNF-α and IFN-γ. Numbers represent % positive cells. Data representative of 2 independent experiments.

