
Figure 6. Antigen density on tumor targets influences CTL response and effector cell degranulation.
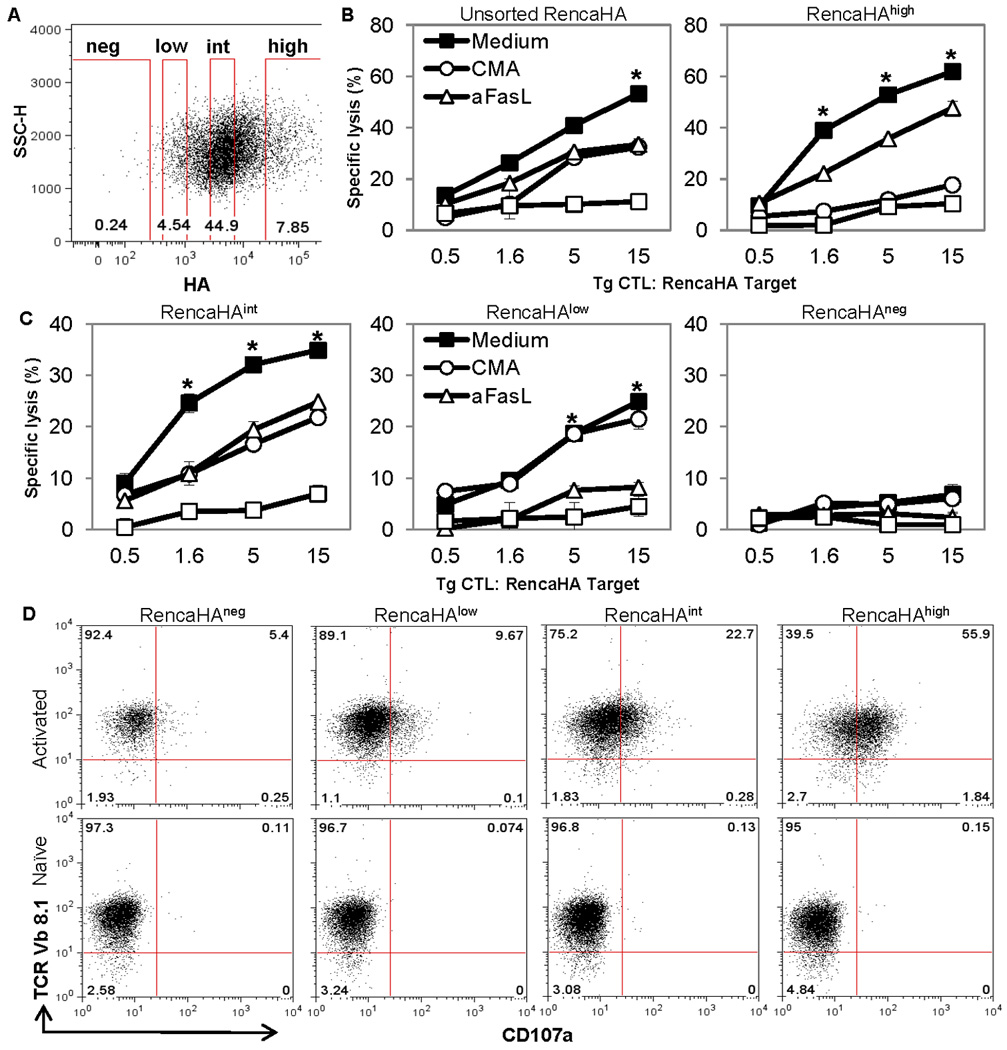
(A) Gating schematic for sorting of HAnegative, HAlow, HAintermediate and HAhigh cells in Renca-HA cells following staining with HA-specific H28-E23 Ab. (B and C) Percent specific lysis of sorted or unsorted Renca-HA cells by activated Tg CTL in the presence of medium, concanamycin A, FasL-neutralizing Ab, MFL4, or a combination of concanamycin A and MFL4. *P < 0.001 (two-sided unpaired t test) with respect to respective control groups. (D) Dot plots of TCR Vβ8.1 versus CD107a on Tg CTL following incubation with sorted Renca-HA tumor cells for 6 h in the presence of monensin. Numbers represent % positive cells. Plots representative of 3 independent experiments.