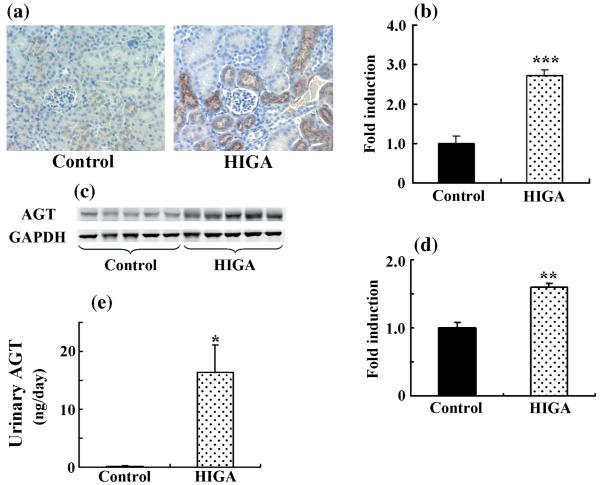
Fig. 4.
Intrarenal angiotensinogen (AGT) protein levels and urinary AGT excretion in control and high IgA strain of ddY (HIGA) mice at 25 weeks of age. (a) Representative photomicrographs of immunoreactivity for AGT in control and HIGA mice at 25 weeks of age. Weak immunoreactivity for AGT was noted mainly in some proximal tubular cells in the control, whereas AGT immunoreactivity increased significantly in HIGA mice. (Original magnification ×200.) (b) Semiquantitative analysis of the intensity of intrarenal AGT immunoreactivity in control and HIGA mice at 25 weeks of age. Twenty tubulo-interstitial lesions were examined for each mouse and the averaged intensity of AGT immunoreactivity for each mouse was used to calculate the ratio relative to control. (c) Intrarenal AGT protein expression determined by western blot in control and HIGA mice at 25 weeks of age. Levels of AGT protein expression, normalized against GAPDH, increased significantly in HIGA mice. (d) Densitometric ratios of AGT bands normalized against GAPDH bands were calculated relative to control. (e) Urinary AGT excretion over 24 h in control and HIGA mice at 25 weeks of age. Data are the mean±SEM. *P < 0.01, **P < 0.001, ***P < 0.0001 compared with control.

