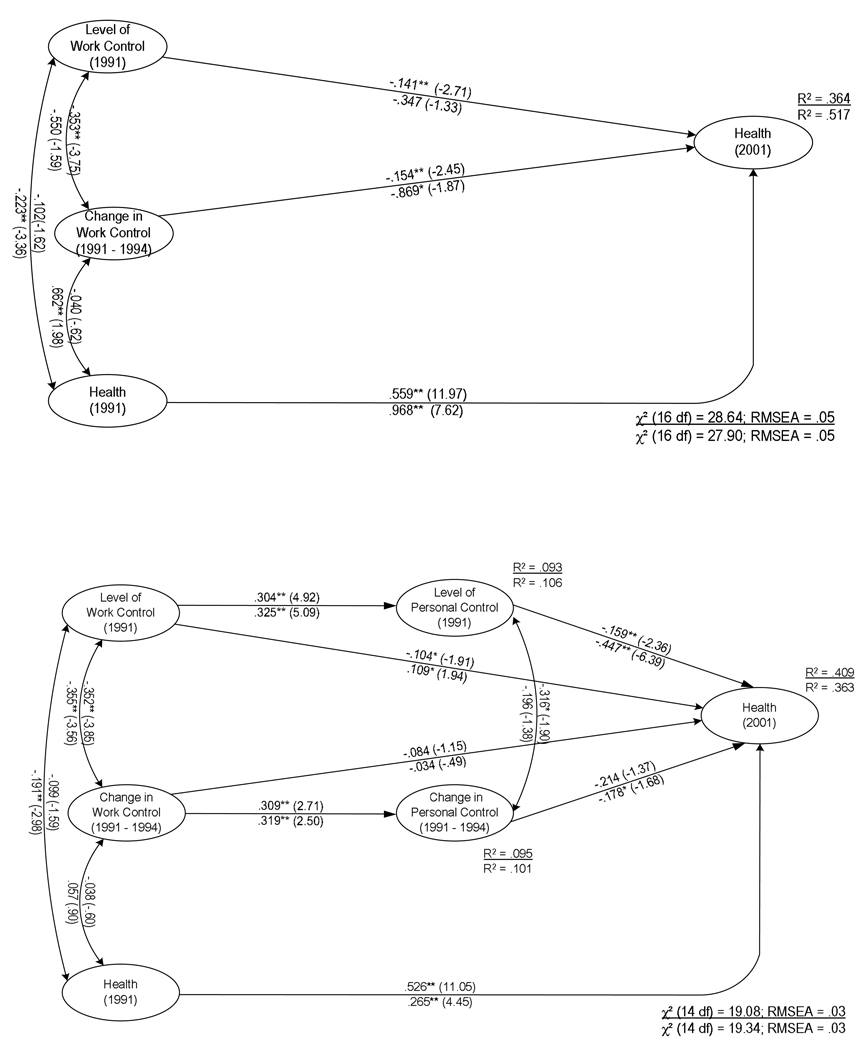
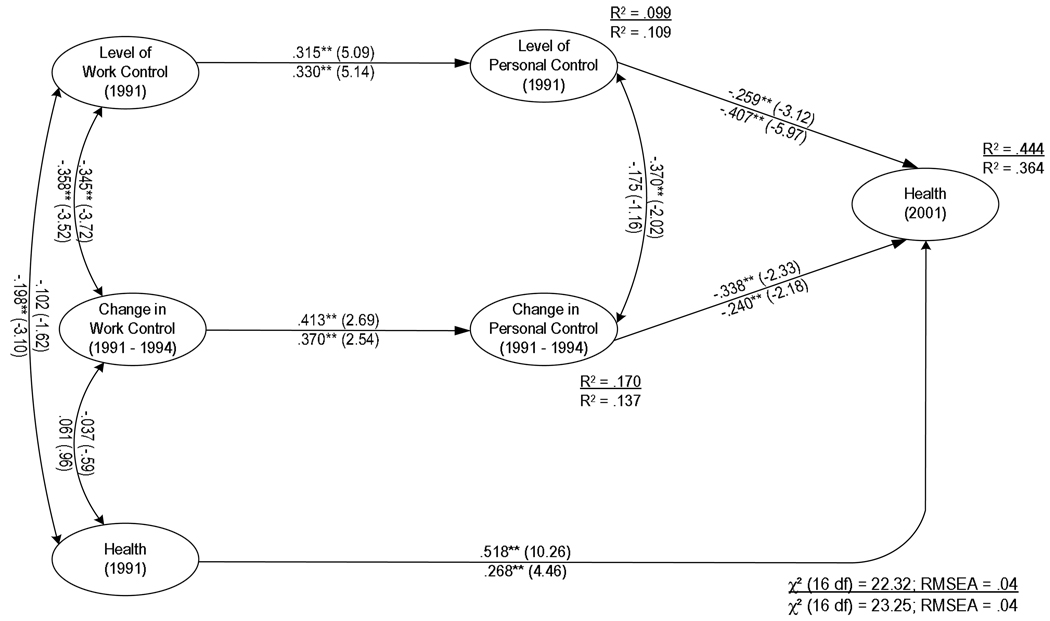
Figure 2.
Figure 2A. The Direct Influence of the Trajectories of Work Control on Health Outcomes (Standardized values with t-ratios in parentheses).
Note. Values above each line represent results predicting poor physical health, and values below the line represent results predicting depressive symptoms. *p < .10; **p < .05
Figure 2B. The Direct and Indirect Influence of the Trajectories of Work Control on Health Outcomes (Standardized values with t-ratios in parentheses).
Note. Values above each line represent results predicting poor physical health, and values below the line represent results predicting depressive symptoms. *p < .10; **p < .05
Figure 2C. The Indirect Influence of Work Control on Health Outcomes (Standardized Values with t-ratios in parentheses).
Note. Values above each line represent results predicting poor physical health, and values below the line represent results predicting depressive symptoms. *p < .10; **p < .05


