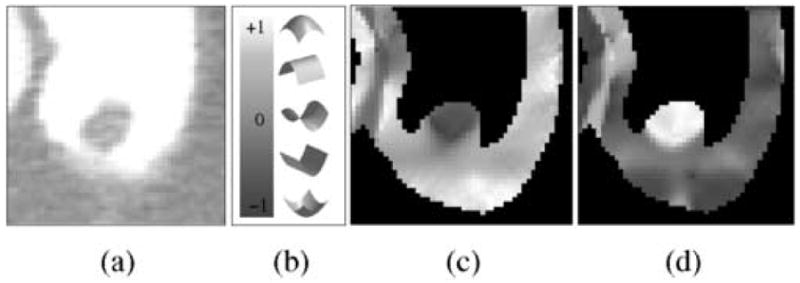
Fig. 2.

Example of the application of the ADM method in the correction of the measured shape of a 10-mm polyp covered by opacified fluid. (a) Axial view of the polyp with a -200±800 HU lung display window setting. (b) The vertical bar indicates the continuous mapping of five discrete local surface example shapes into shape index values. (c) Visualization of the values of the shape index within the extracted region of the colonic wall in (a). The shapes indicated by the shape index values are mostly opposite to the visually perceived soft-tissue shapes. (d) Visualization of the shape index values in the same region after the application of the ADM method. The indicated shapes now match the visually perceived shapes.
