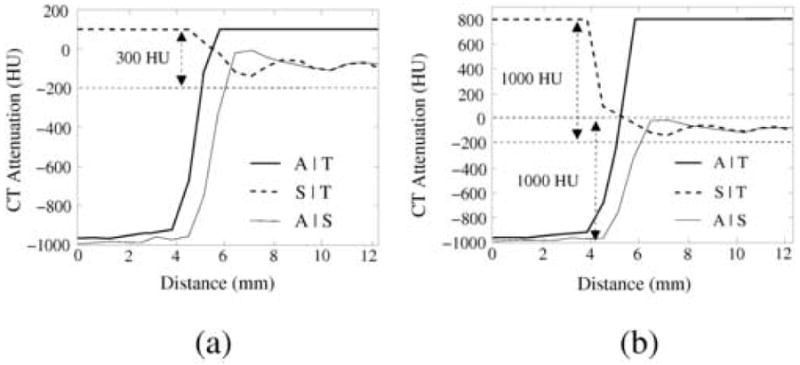
Fig. 6.

Line samples of three different interface types in the phantom data with 300 HU tagging during the (a) first and (b) second step of the GIA method. The data were preprocessed by the ADC method. Abbreviations: A|S = air and soft tissue; A|T = air and tagging; S|T = soft tissue and tagging. In (a), CT attenuations >100 HU have been clipped to 100 HU. The contrast between soft tissue and tagging is much lower than that between the other interfaces. In (b), CT attenuations >100 HU have been clipped to 800 HU. The contrast between air and soft tissue is much lower than that between air and tagging. Based on these data, the three interfaces may be differentiated as explained in the text.
