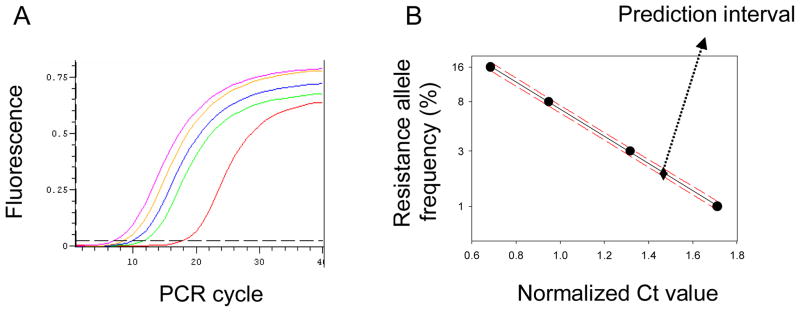
Fig. 6.
Typical amplification patterns of rtPASA using the DNA templates containing 0~16% resistant alleles (A) and the regression line generated from the plot of normalized Ct value versus the log of resistance allele frequency (B). The regression line is indicated by a solid line with the upper and lower 95% prediction lines indicated by dashed lines in Panel B.

