
Figure 1.
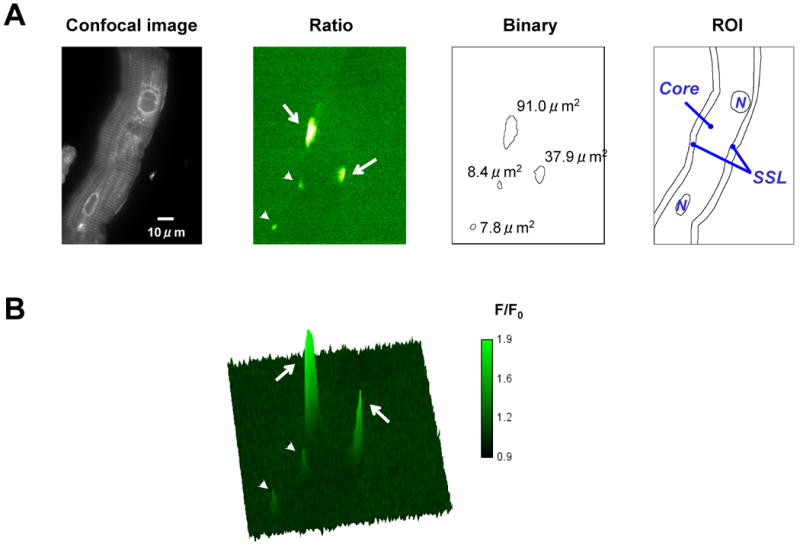
Typical 2D image of an isolated canine Purkinje cell. Amplitude of the event was calculated from ratio images. Spatial extent of the event and the event rate were calculated from binary images using IDL program (IDL6.0, Research Systems). In ratio images, arrows indicate wide long lasting event (WLE) and arrow heads indicate typical events (TEs) (Panels A, B). The amplitude and spatial extent of WLEs were markedly larger than those of typical events. A region of interest (ROI) was drawn on a confocal image and then superimposed on binary images to determine the subcellular location (SSL or Core) of events using ImageJ. N indicates nucleus.