
Figure 3.
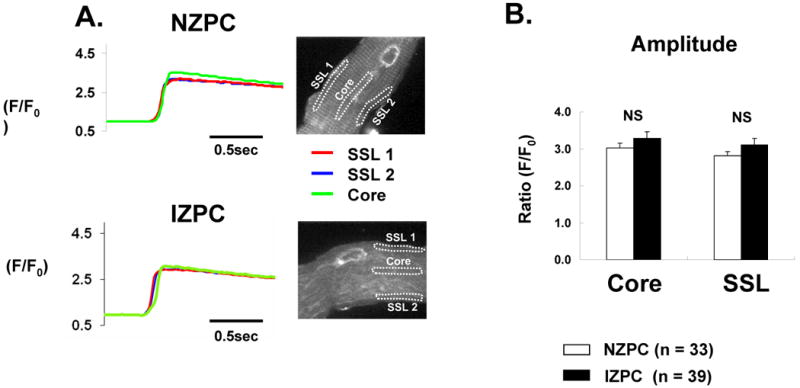
Panel A Typical caffeine induced Ca2+ release by region in an NZPC and IZPC. Right tracings are examples from two SSL regions and one Core region in each cell represented. Panel B. Average data are plotted. NS indicates not significant.
Official websites use .gov
A
.gov website belongs to an official
government organization in the United States.
Secure .gov websites use HTTPS
A lock (
) or https:// means you've safely
connected to the .gov website. Share sensitive
information only on official, secure websites.
Panel A Typical caffeine induced Ca2+ release by region in an NZPC and IZPC. Right tracings are examples from two SSL regions and one Core region in each cell represented. Panel B. Average data are plotted. NS indicates not significant.