Figure 3.

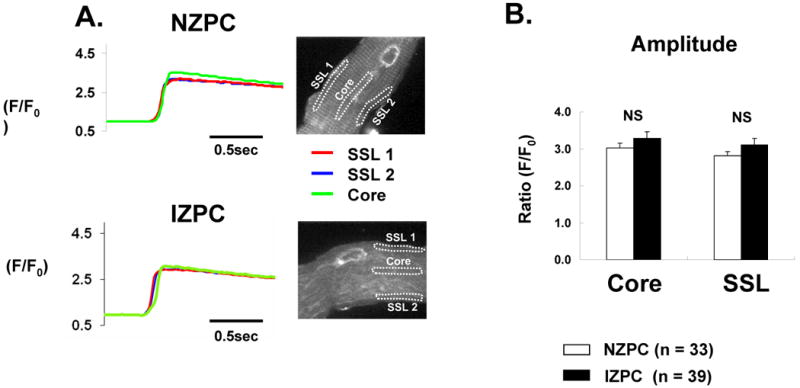
Panel A Typical caffeine induced Ca2+ release by region in an NZPC and IZPC. Right tracings are examples from two SSL regions and one Core region in each cell represented. Panel B. Average data are plotted. NS indicates not significant.

Panel A Typical caffeine induced Ca2+ release by region in an NZPC and IZPC. Right tracings are examples from two SSL regions and one Core region in each cell represented. Panel B. Average data are plotted. NS indicates not significant.