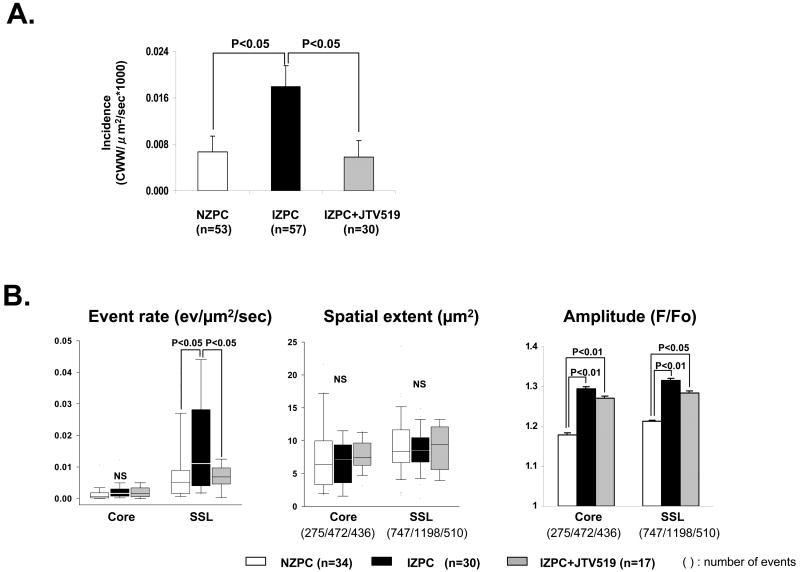
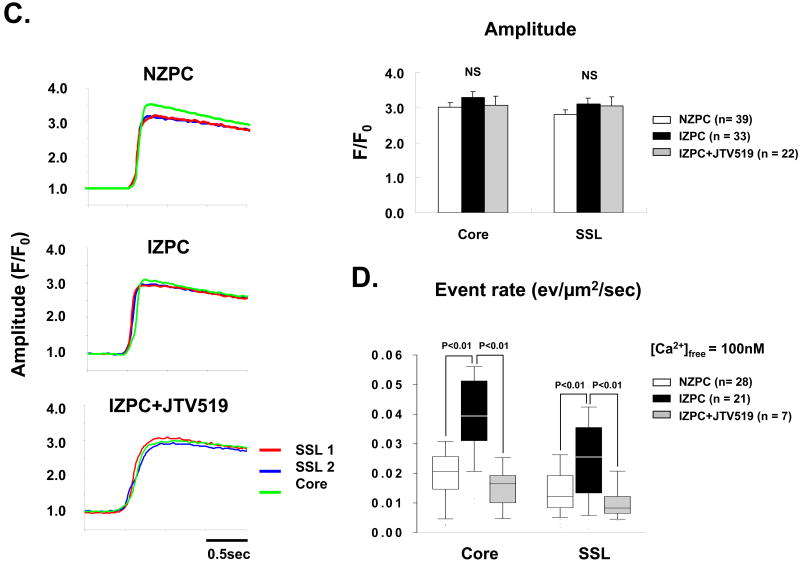
Figure 6.
Panel A. Graph shows the incidence of cell wide Ca2+ waves (CWW) in NZPCs and in IZPCs in the absence and presence of JTV519 (K201) 1μM (grey bar). The One-Way ANOVA and Tukey's Post Hoc Test were carried out for the statistics. Panel B shows TE event rate, spatial extent and amplitude in IZPCs in the absence and presence of JTV519 (K201) (grey bars). Total number of events used is shown in parentheses. Kruskal-Wallis test and Steel-Dwass test were carried out for the statistics of the event rate and spatial extent. The One-Way ANOVA and Tukey's post hoc test were carried out for the statistics of the amplitude. Panel C shows typical caffeine induced Ca2+ release transients by region in an intact NZPC and an IZPC in the absence and presence of JTV519 (K201). The One-Way ANOVA was used. Panel D shows the effects of JTV519 (K201) on event rate in saponin treated permeabilized IZPCs. Note in the presence of JTV519 (K201) IZPC event rate was normalized to that of NZPCs (white bars) (free Ca2+ =100nM). Kruskal-Wallis and Steel-Dwass tests were carried out for the statistics. NS indicates not significant.


