
Figure 1.
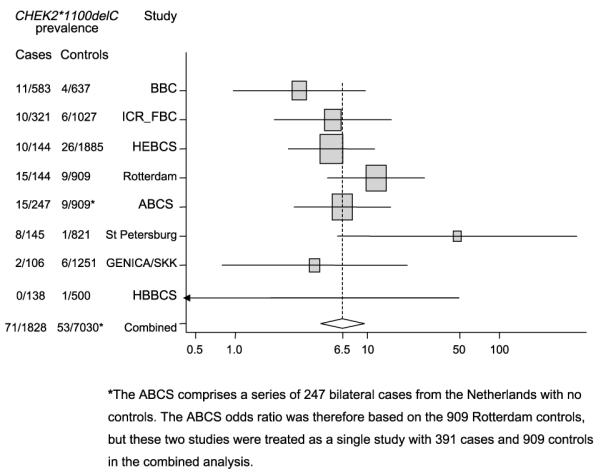
Estimated ORs with 95% CIs for the breast cancer ORs associated with CHEK2*1100delC. The area of each square is proportional to the variance of the log OR. The Hannover Breast Cancer study, where there were no carriers among cases is represented as a line with no square as the log OR and its variance cannot be calculated. An approximate OR and 95% CI were derived for Supplementary Table S1.