
Figure 4. Diffusion tensor imaging measurements of FA and fibre tracking.
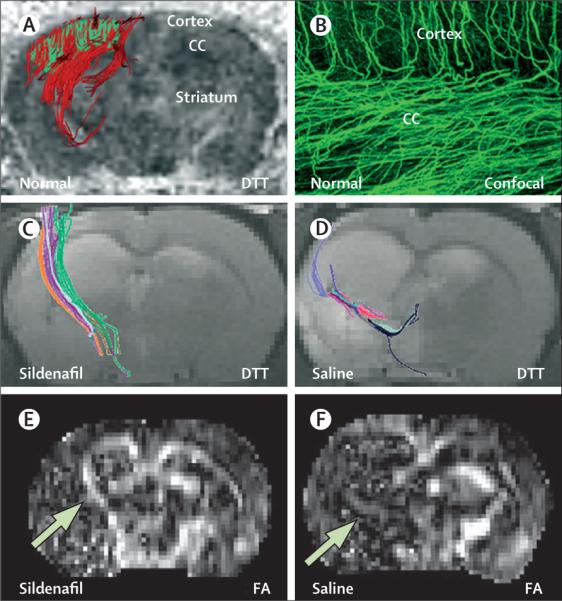
(A) A three-dimensional DTT image shows tracking of axonal projections (red) in a selected area of the CC and cortex (green). (B) A confocal image shows similar patterns of axonal projections in the same area. Treatment of stroke with sildenafil increases axonal projections (C) and FA concentrations (E, arrow) at the ischaemic boundary compared with animals treated with saline (D and F, arrow). CC=corpus callosum. DTT=diffusion tensor tractography. FA=fractional anisotropy.