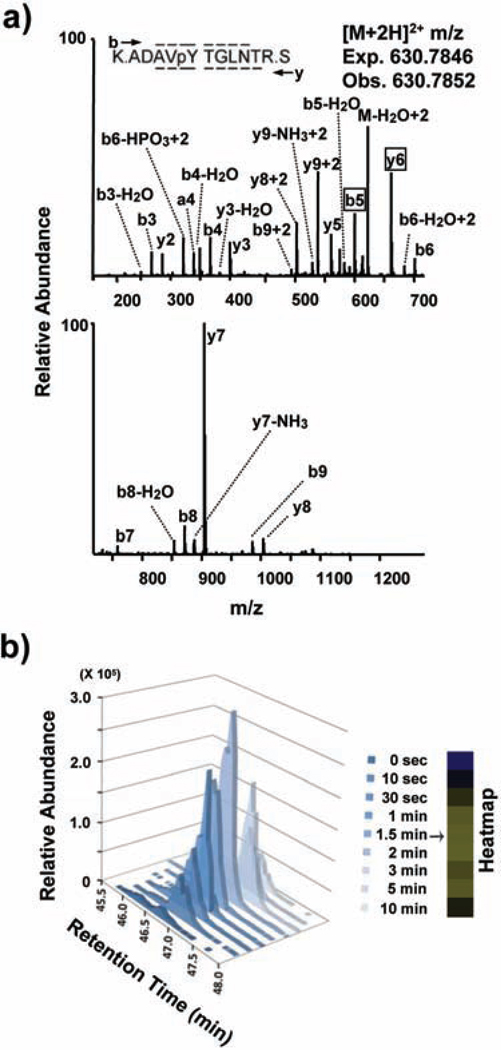
Figure 3.
Manual validation and quantitation of the FcεRIγ ITAM-containing phosphopeptide. A) MS/MS spectrum of the FcεRIγ-derived phosphopeptide ADAVpYTGLNTR. A single MS/MS spectrum is displayed on two axes to enhance detail. Peaks are assigned to theoretical a, b, or y type ions or corresponding neutral loss of ammonia or water from b, or y ions. Sequence coverage across the peptide is represented by overlines or underlines on the peptide sequence. Boxed phosphorylation site-determining peaks (y6 & b5) and the absence of an assigned M-H3PO4 peak definitively indicate that the phosphorylation site is on Tyr65 and not on Ser66. B) Selected-ion chromatogram (SIC) or plot of the ion current over time for m/z 930.7846 corresponding to the (M+2H)2+ of the FcεRIγ-derived phosphopeptide ADAVpYTGLNTR for all the 9 time points. The corresponding heatmap representing the same peptide's relative abundance across the 9 time points is shown.

