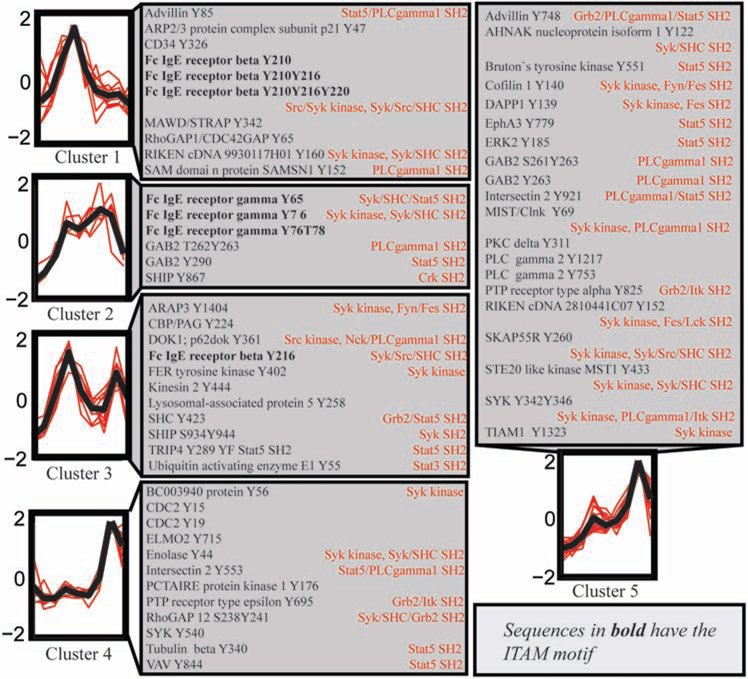
Figure 8.
Clustering of phosphoproteomic time series from MCP5 cells. Peptide peak areas were normalized and clustered according to their temporal profiles using k-means clustering. Five clusters are shown with the mean temporal profile (black line) and individual peptide temporal profiles (red lines) for each cluster. Protein sequences were searched against the Minimotif Miner (http://sms.engr.uconn.edu/) database to find sequence motifs surrounding phosphorylated tyrosine residues (indicated in red text).

